We may earn money or products from the companies mentioned in this post. This means if you click on the link and purchase the item, I will receive a small commission at no extra cost to you ... you're just helping re-supply our family's travel fund.
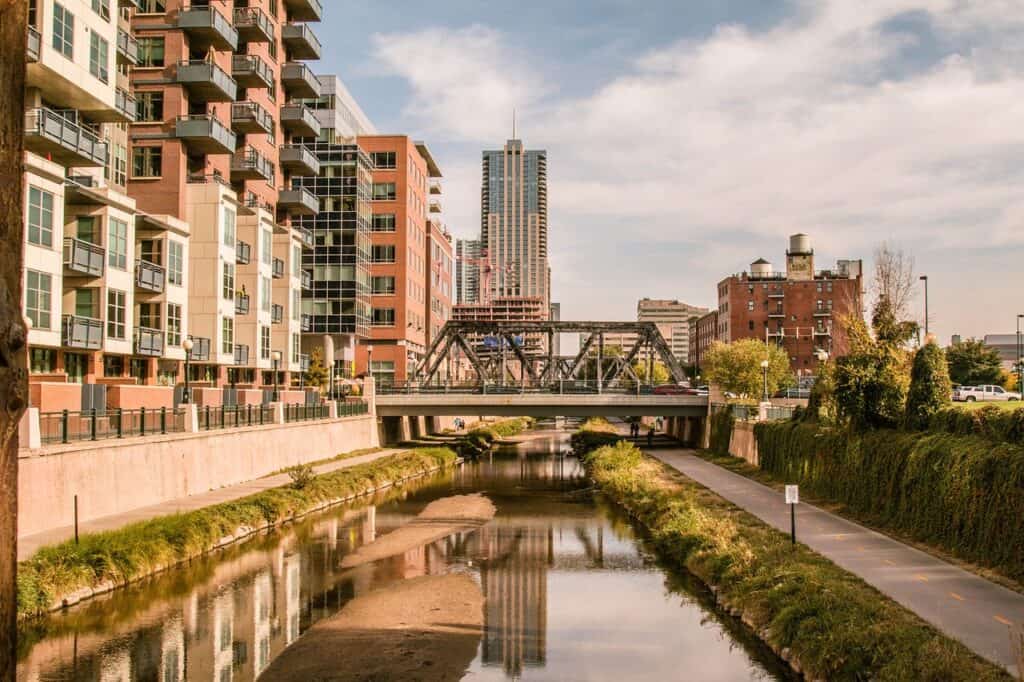
Across the United States, several walkable downtowns, once praised for lively sidewalks and dense, people-friendly streets are now facing growing concerns about public safety. Much of this shift stems from visible disorder, reduced daytime crowds, higher commercial vacancies, and changing commuter habits. While these concerns don’t always align with crime statistics, they strongly influence how residents and visitors interpret safety, especially as many urban cores operate with 30–45% fewer daily office workers than before 2020.
1. Downtown Los Angeles (California)
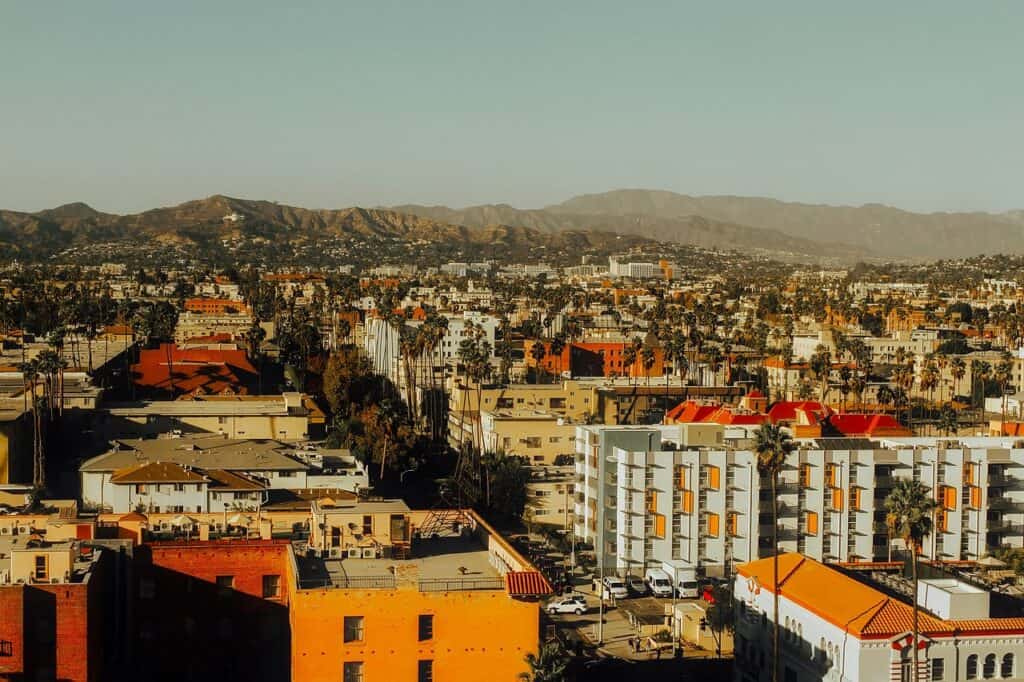
Public concerns in Downtown LA have increased over the past few years, largely due to visible disorder, declining retail presence, and reduced foot traffic after remote-work adoption. Office occupancy sits around 48%, creating long stretches of underused sidewalks that heighten unease among pedestrians. Vacancy rates for ground-floor retail have reached roughly 28%, and surveys show that about 63% of visitors report feeling “less safe than in 2019,” even as citywide violent-crime trends fluctuate.
2. San Francisco : Union Square & Mid-Market (California)
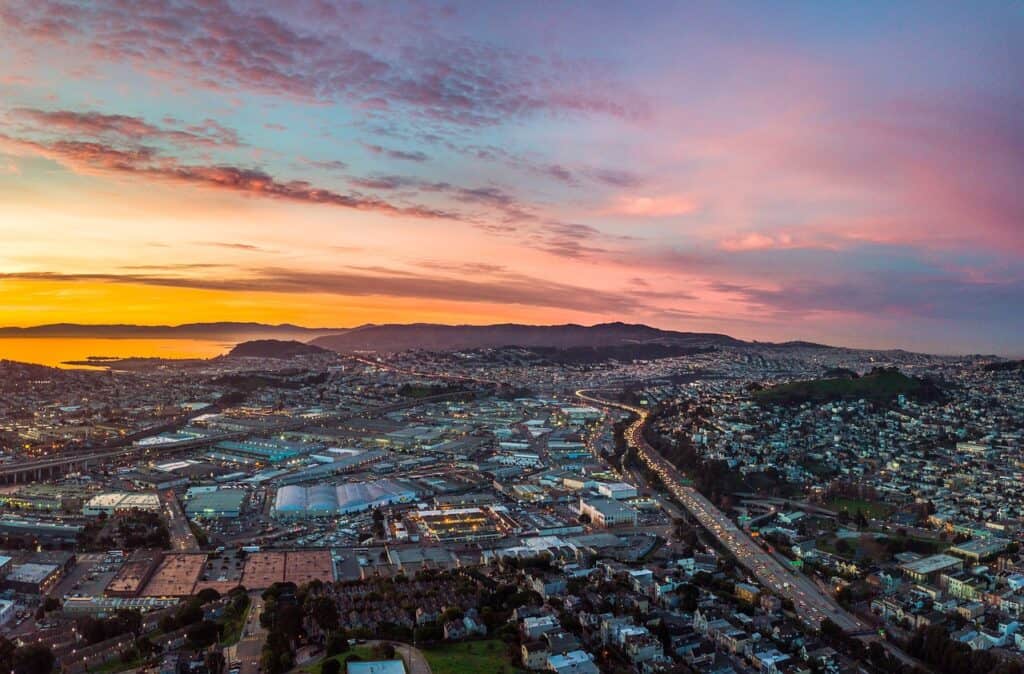
San Francisco’s dense, walkable downtown has faced rising concerns linked to shuttered stores, inconsistent foot-traffic recovery, and transit-dependent conditions. Pedestrian activity remains about 40% below 2019 levels, reducing natural street oversight. Retail vacancy surpassed 30%, intensifying the feeling of decline. Around 58% of surveyed residents say the area “feels less orderly,” even though official citywide crime reports show mixed year-to-year changes rather than a uniform surge.
3. Portland : Downtown Core (Oregon)

Portland’s walkable downtown once thrived on festivals and compact blocks, but shifts in commuter patterns and lingering storefront vacancies have changed public perceptions. Office attendance remains roughly 55% of pre-2020 levels, while small-business closures climbed by an estimated 22% between 2020 and 2024. These conditions contribute to a sense of fragility among pedestrians, with 61% of respondents in a regional survey stating they avoid the core after sunset due to discomfort rather than confirmed crime trends.
4. Seattle : Pike–Pine & Central Business District (Washington)
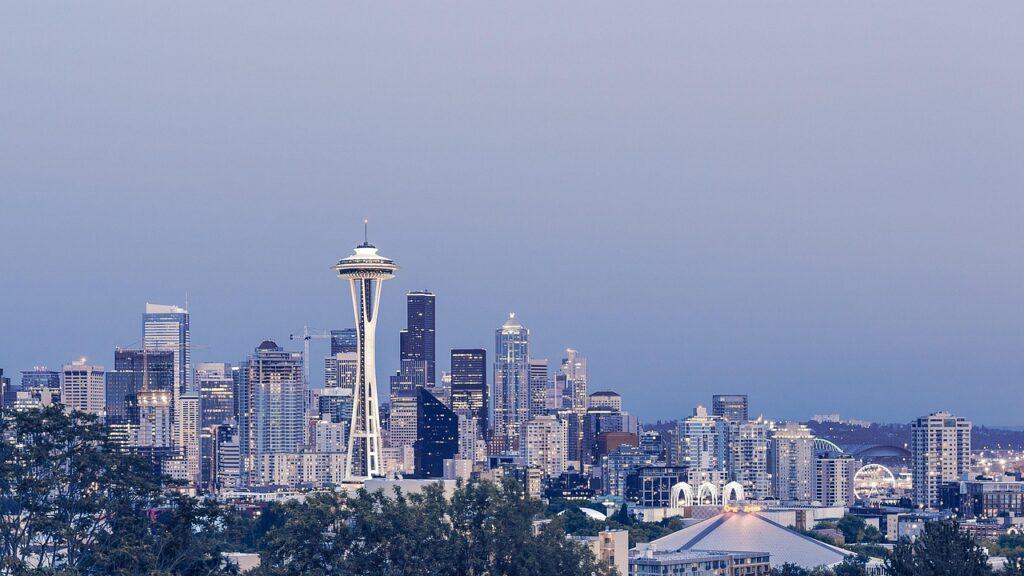
Seattle’s downtown is known for tight, walkable blocks, but concerns rose during the pandemic recovery period as foot traffic dipped and public-space issues became more visible. Pedestrian volumes were still about 35% lower than 2019 as of late 2024, even though the city reported improvements in certain offenses. Retail vacancy in key corridors reached approximately 18%, contributing to uneven street activity. Around 57% of local workers report feeling “less secure” during off-peak hours.
5. Chicago : Loop & River North (Illinois)
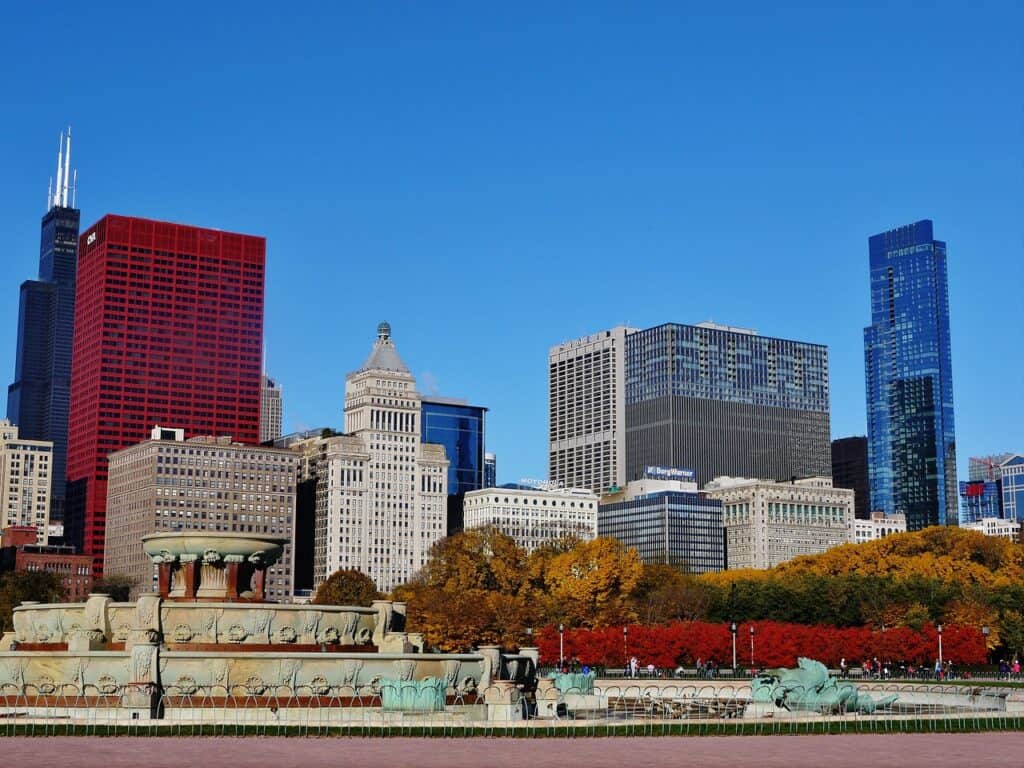
Chicago’s central districts remain walkable and vibrant, yet worries have grown due to fluctuating retail-theft patterns and reduced commuter density. The Loop currently operates at roughly 52% of pre-pandemic office attendance, creating quieter stretches where people report reduced comfort. Retail theft reports citywide rose around 25% over five years, shaping public perception even if incidents are widely dispersed. Surveys show 59% of Loop visitors feel safety “depends heavily on time of day.
6. New York : Midtown & Lower Manhattan (New York)
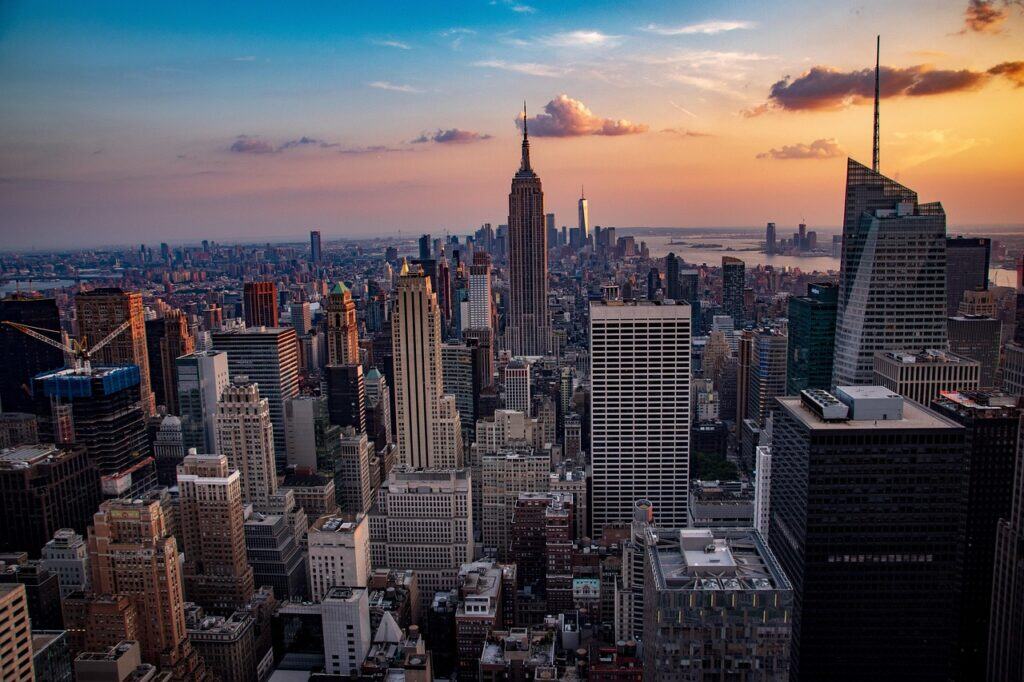
New York remains one of the world’s most walkable downtowns, but changing crowd patterns and storefront turnover have influenced how safe visitors feel. Midtown foot traffic recovered to about 70% of 2019 levels, leaving gaps during evening hours. Commercial vacancy reached roughly 17%, the highest in several decades. Although citywide violent crime shows year-to-year variability, 54% of surveyed residents say certain blocks “feel more chaotic” due to dense tourism and high transit dependence.
7. Philadelphia : Center City (Pennsylvania)
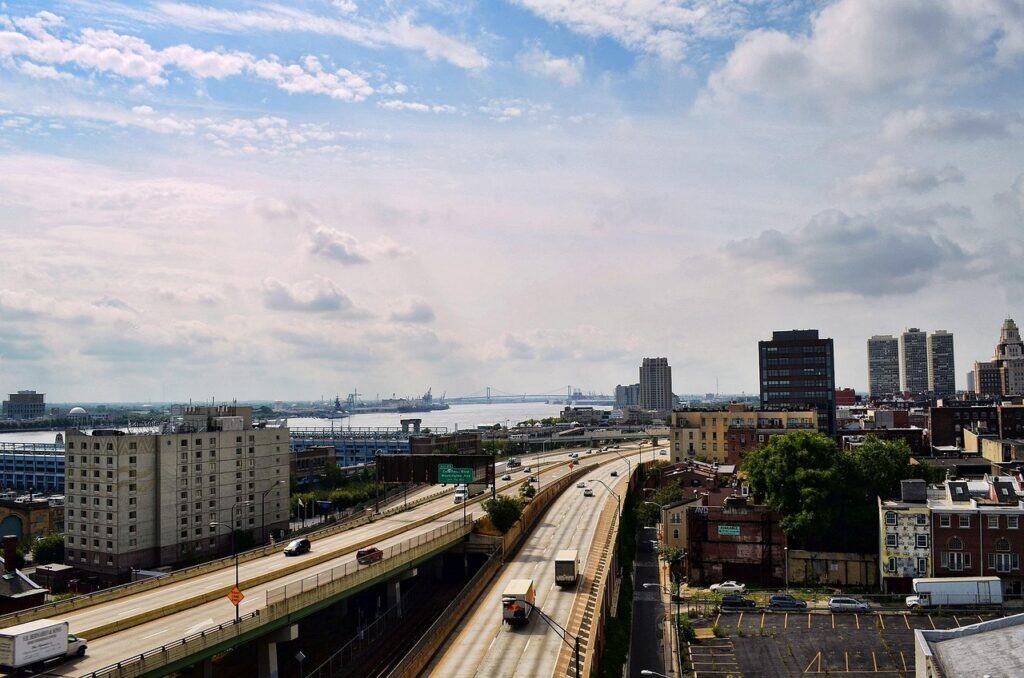
Center City offers compact, highly walkable streets, yet perceptions of safety have shifted amid rising commercial vacancies and inconsistent foot-traffic flows. Office attendance stands near 58% of 2019 levels, while retail vacancies approach 20%. Public surveys reveal that 62% of residents feel the downtown area has “more visible disorder” than before the pandemic, even though local police data shows mixed changes rather than a consistent upward trend in serious offenses within the core.
8. Denver : Central Business District & LoDo (Colorado)
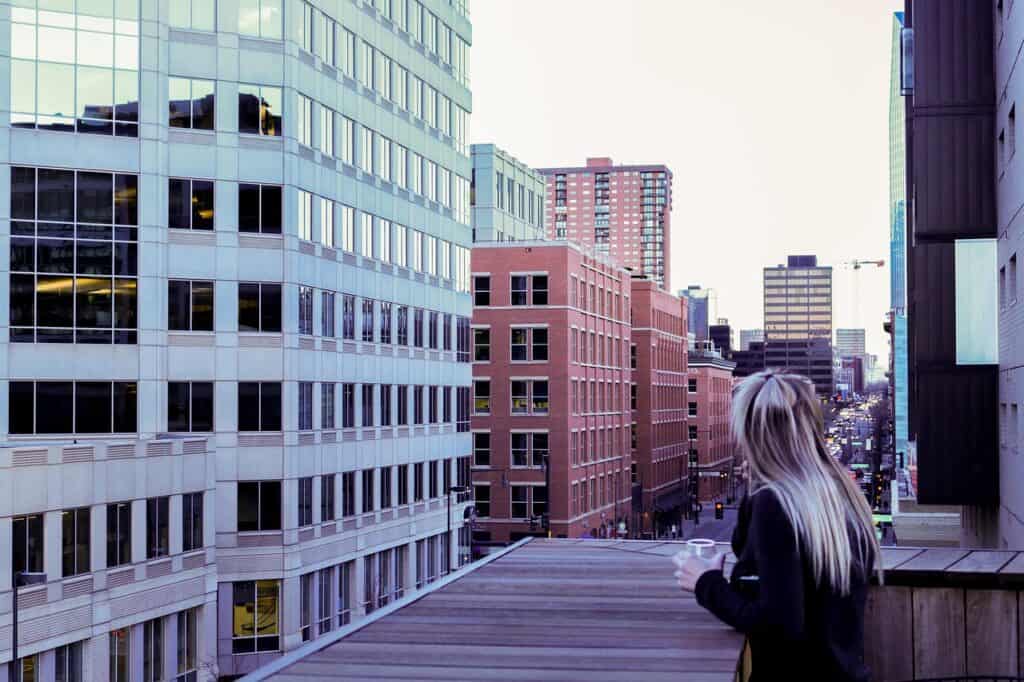
Denver’s walkable core has seen concerns rise as foot-traffic patterns changed and commercial spaces emptied. Office occupancy hovers around 55%, and ground-floor retail vacancy has climbed past 26%, leaving wider gaps in street activity. Transit ridership remains 30–35% below pre-2020 numbers, contributing to quieter night conditions. Roughly 56% of surveyed workers express unease walking after normal business hours not due to a clear crime spike, but to environmental factors shaping perception.
9. Minneapolis : Downtown West & Warehouse District (Minnesota)
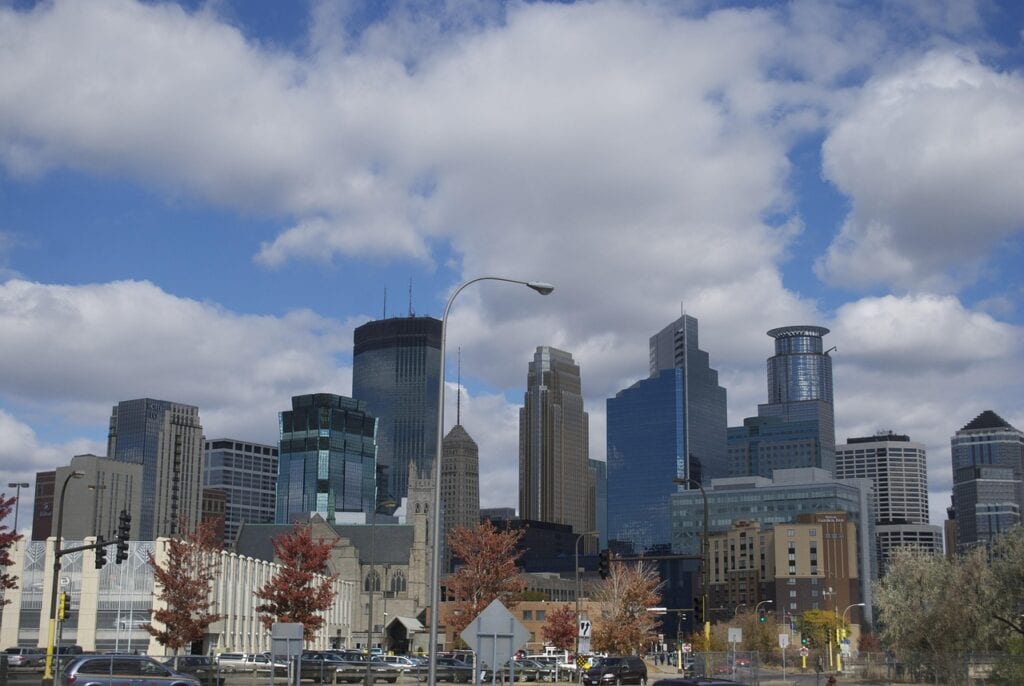
Minneapolis’ compact grid and walkable districts have faced heightened safety concerns since 2020, driven primarily by declining commuter levels and shifts in public-space management. Daily workforce presence remains near 50% of earlier norms, weakening the crowds that once offered passive surveillance. Retail closures increased approximately 24% in four years, deepening the sense of uneven recovery. About 60% of surveyed residents say the area “feels less predictable,” even as official crime data shows varied trends.