We may earn money or products from the companies mentioned in this post. This means if you click on the link and purchase the item, I will receive a small commission at no extra cost to you ... you're just helping re-supply our family's travel fund.
Air travel can erase a vacation day before the plane ever leaves the ground. A late inbound, a brief ground stop, or a storm cell over the wrong runway can turn a smooth itinerary into missed rentals, lost hotel nights, and rebooked tours. Delay risk is not evenly spread. Some airports sit under crowded airspace, depend on connection banks, or face recurring capacity and staffing pressure. DOT’s on-time data shows patterns that repeat month after month, and those patterns shape what happens when the schedule snaps.
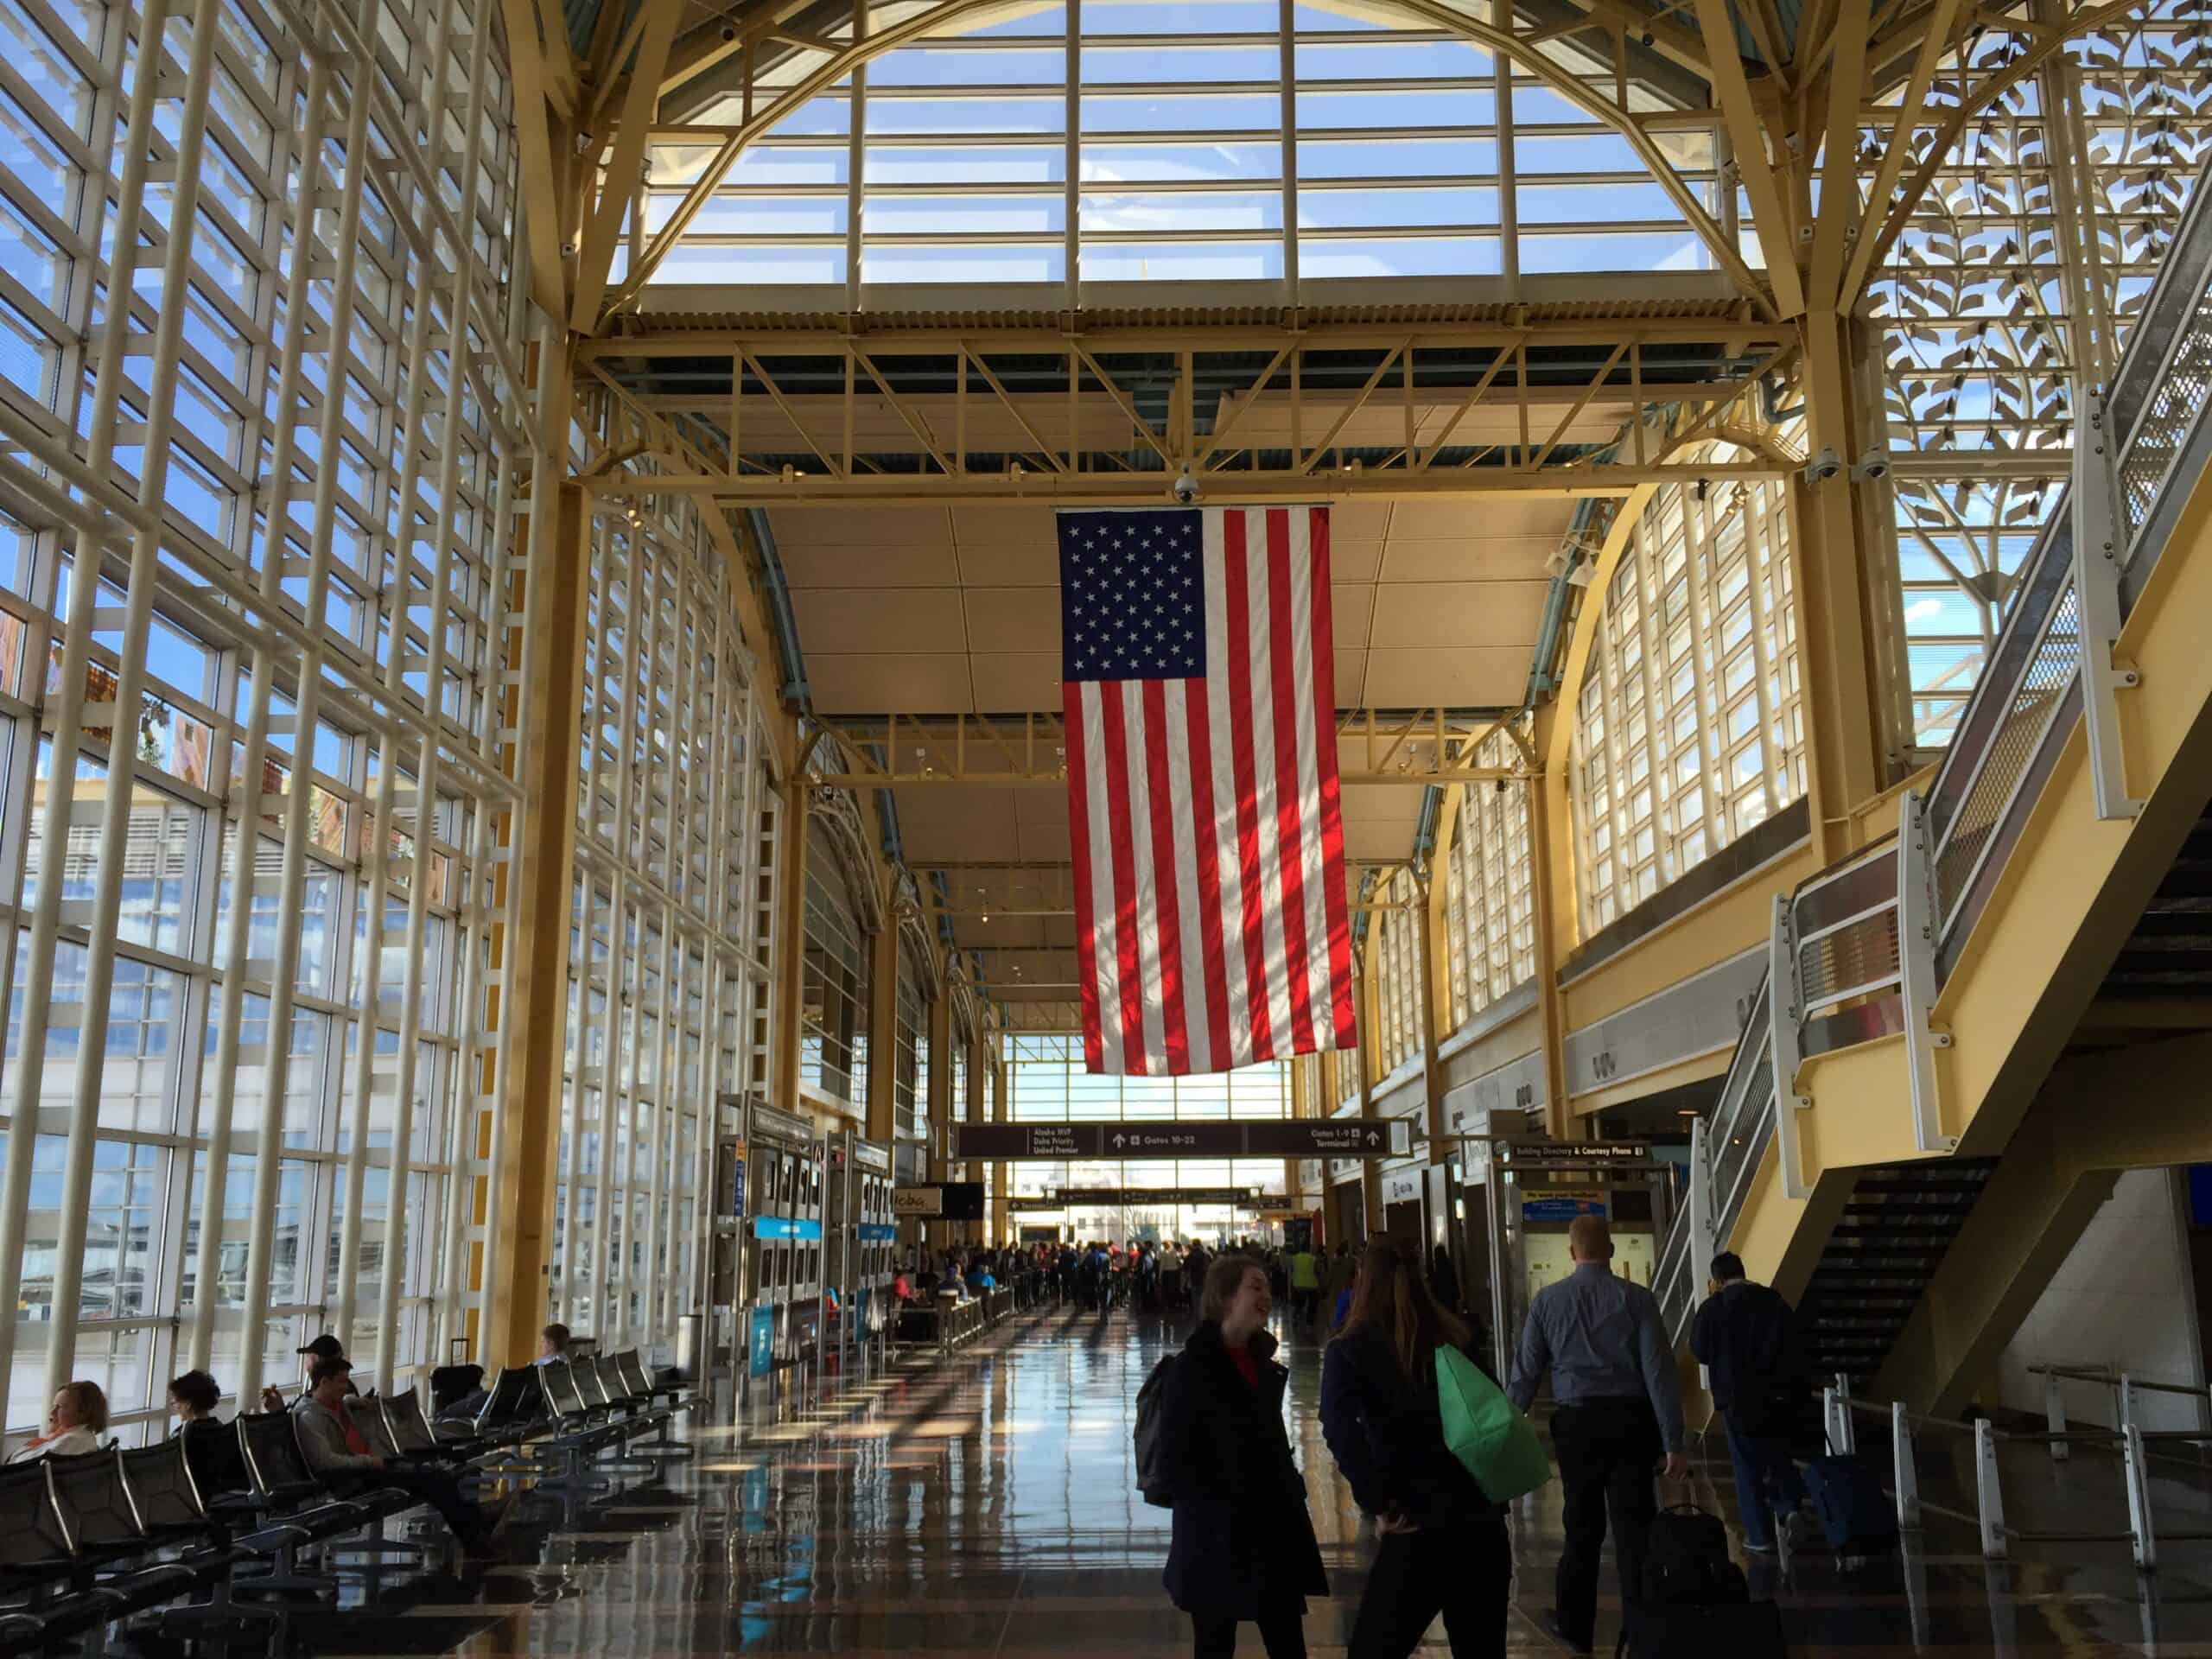
Ronald Reagan Washington National Airport (DCA)
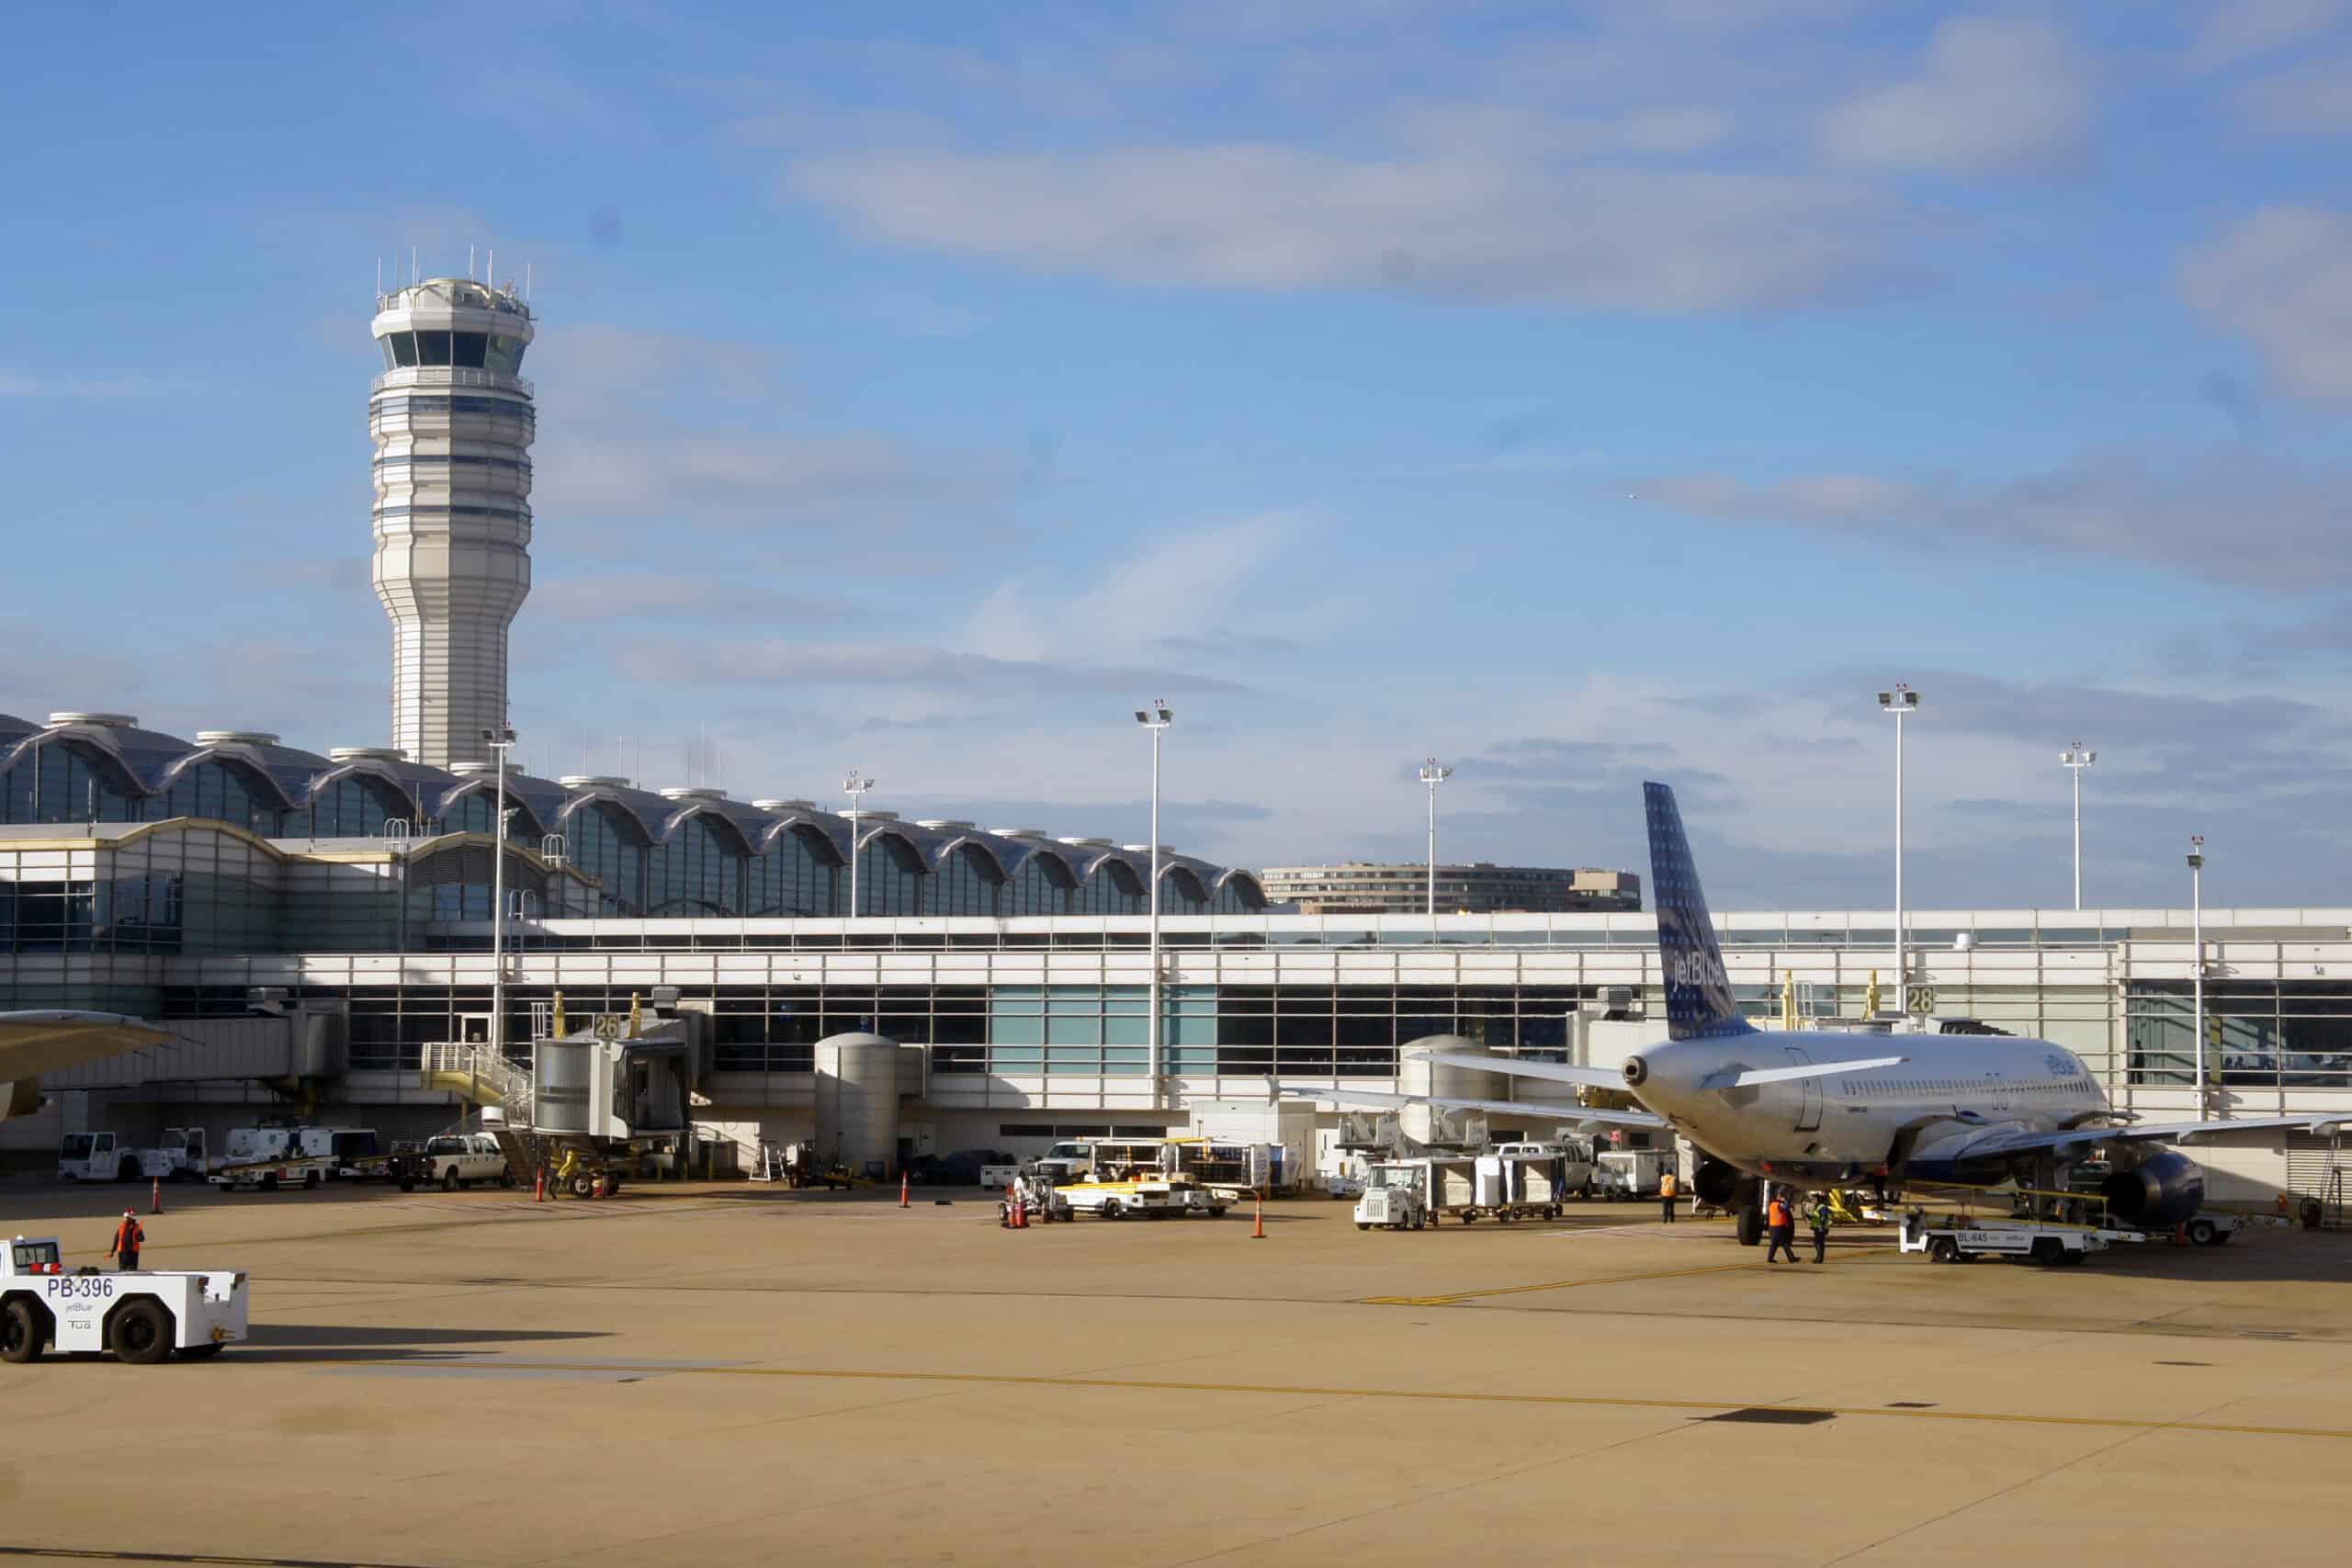
Reagan National sits inside tightly managed Washington airspace, with river approaches and limited runway flexibility that leave little slack when the cadence breaks, even on blue-sky days. In DOT’s June 2025 Air Travel Consumer Report, on-time arrivals at DCA were 62.0%, a rough number for an airport that supports a lot of short, connection-heavy itineraries. When a brief ground stop or traffic program lands, delays compound into gate holds, missed regionals, and rebooks that slide to the next morning because late flights sell out, alternates are scarce, and every minute erases the buffer a vacation depends on at the gate.
Newark Liberty International Airport (EWR)
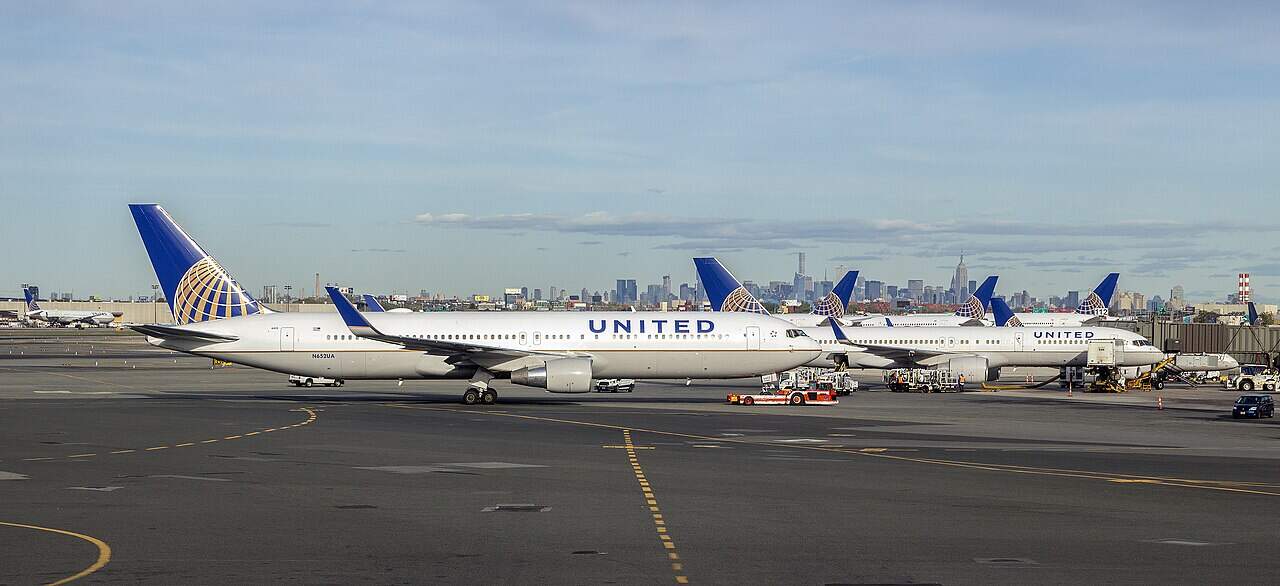
Newark lives in the crowded New York corridor, where weather, runway queues, and airspace restrictions can turn a small slip into a full afternoon rewrite, especially during peak banks. In DOT’s June 2025 report, on-time arrivals at EWR were 70.5%, and the FAA has issued orders and statements aimed at easing delays tied to controller staffing and other system constraints. When the system gets tight, the disruption arrives in waves: long ground delays, gate swaps, missed connections, and rebooking screens that empty out fast because so many itineraries funnel through the same pinch point for major carriers and their partners.
Dallas Fort Worth International Airport (DFW)
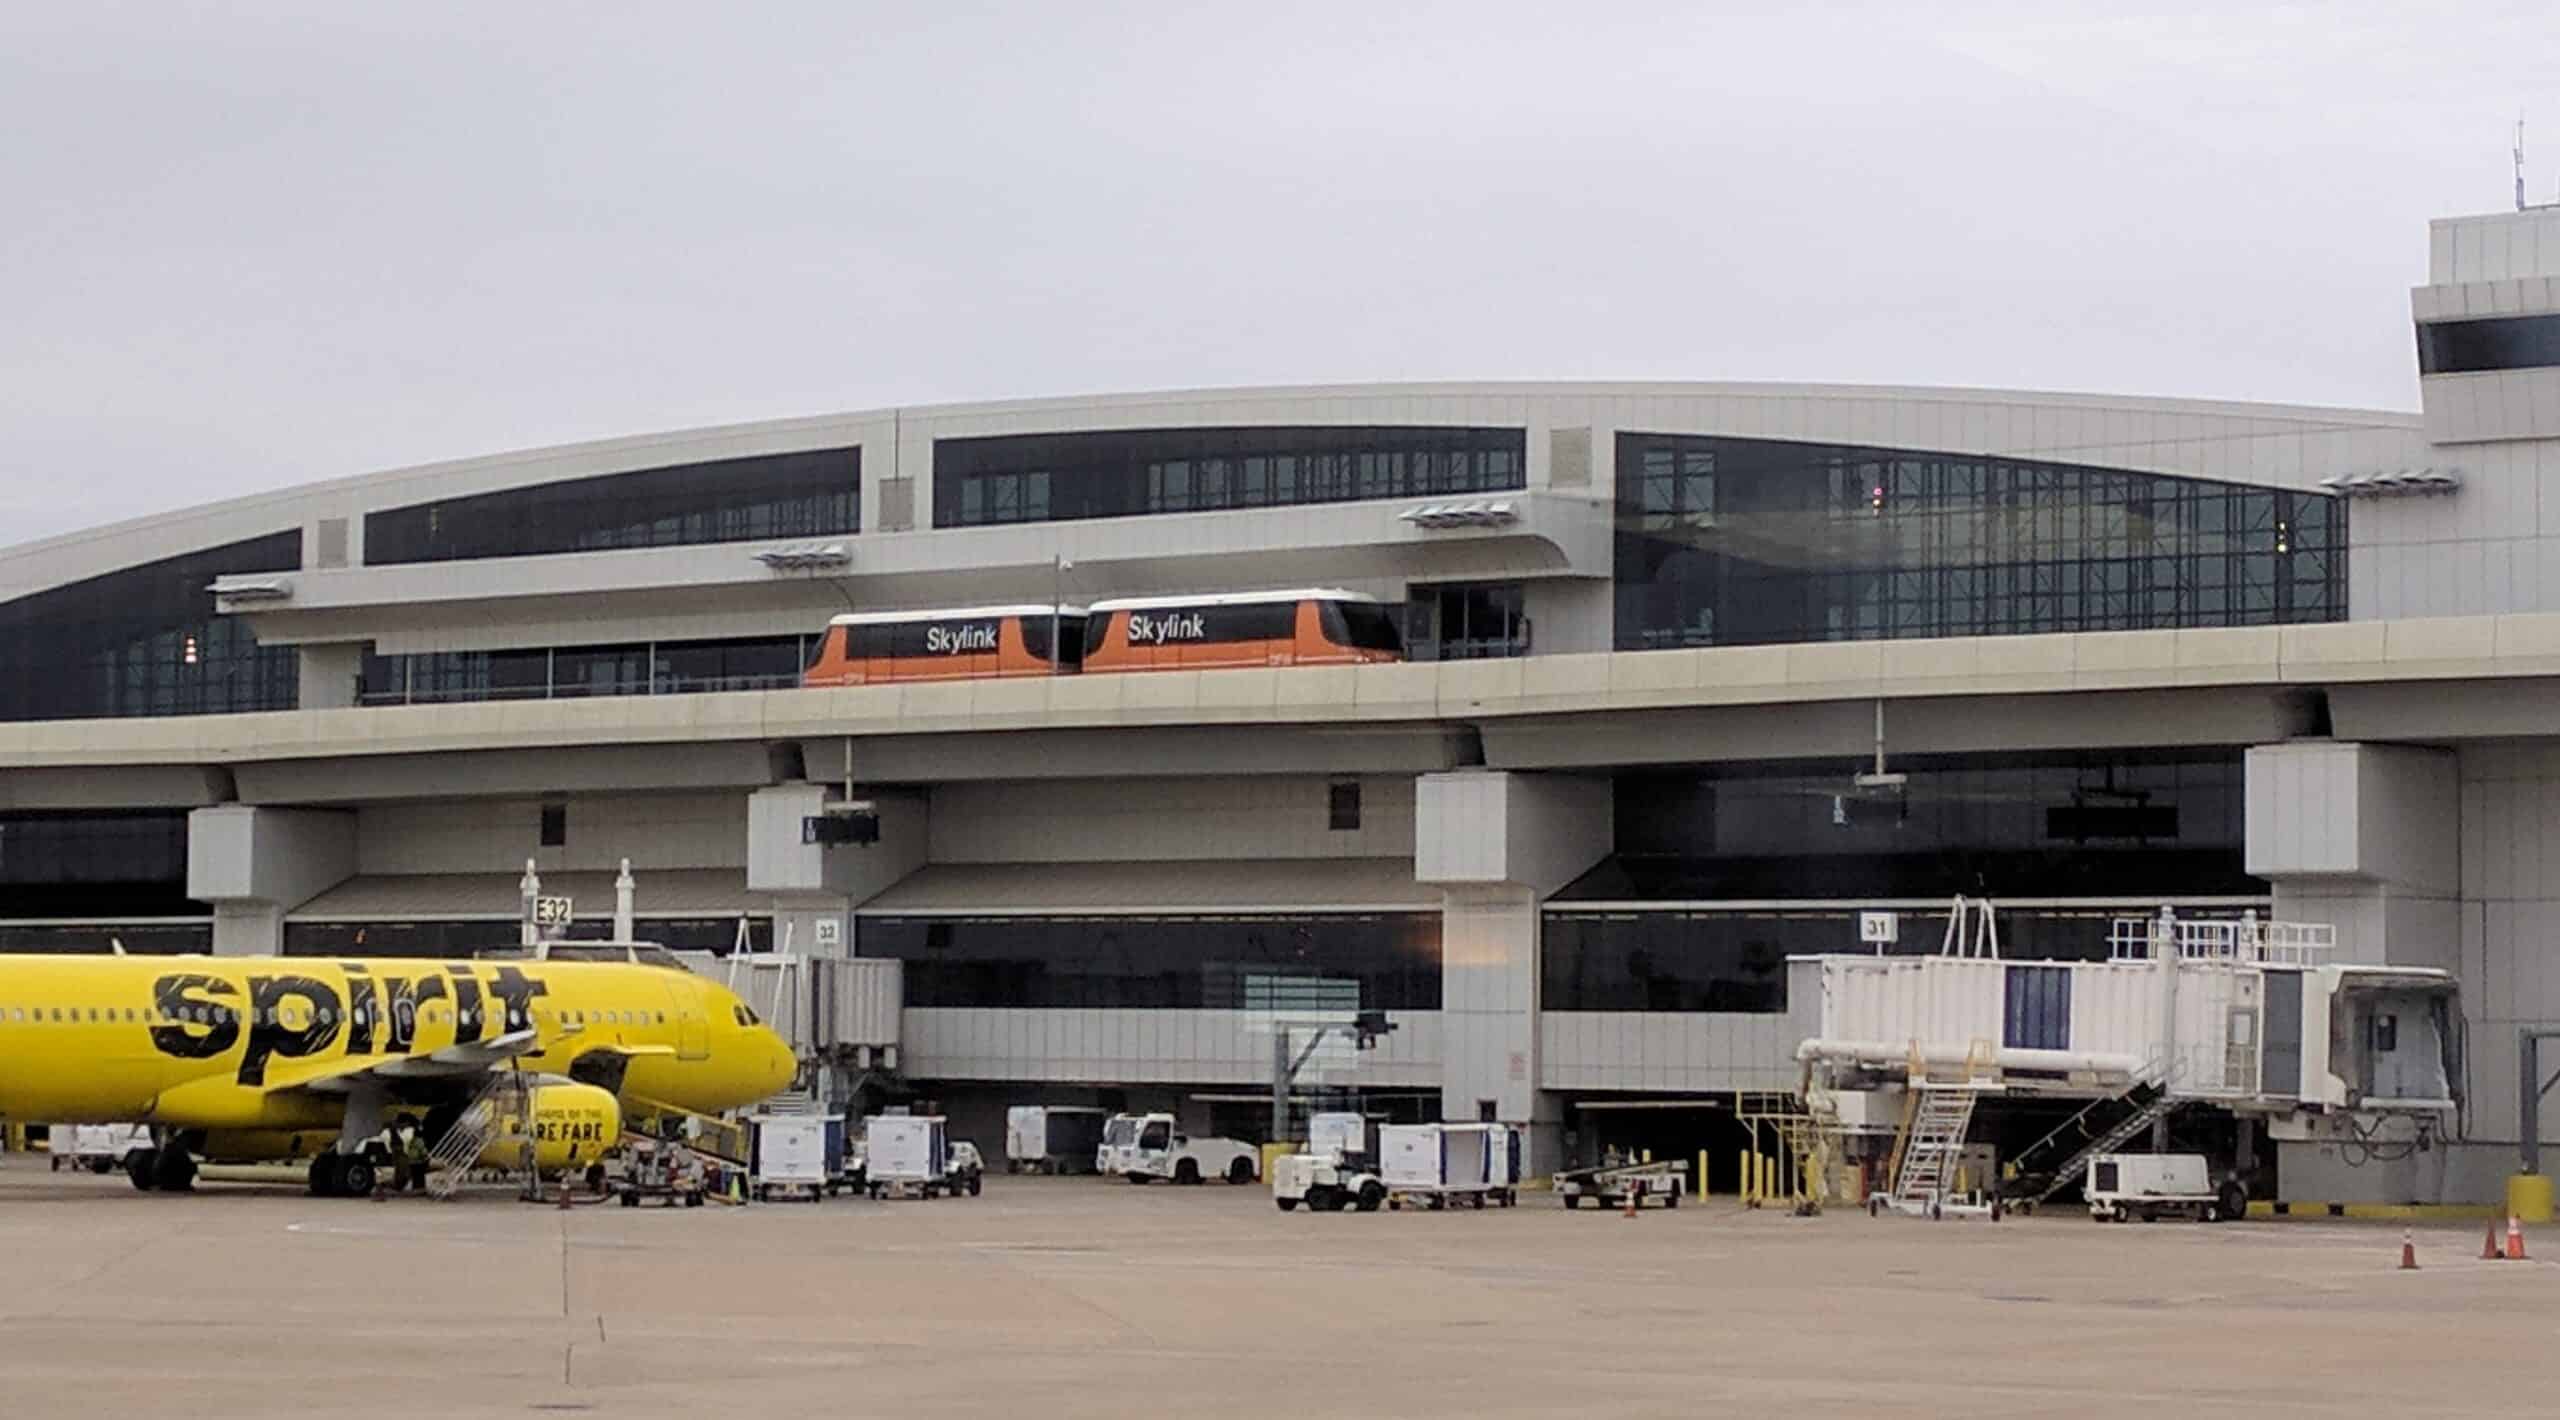
DFW runs on massive connection banks, which feels efficient until North Texas storms, summer heat, or a regional traffic program forces wider spacing that the timetable cannot absorb, hour after hour. In DOT’s June 2025 Air Travel Consumer Report, on-time arrivals at DFW were 65.5%, a reminder that even a well-built hub can lose rhythm when gates back up and crews time out. The frustrating part is the false start: pushback happens, then a long sit, then a new queue, while timed park entries, dinner reservations, cruises, and rental counters keep counting down, with no clean way to win those minutes back once the dominoes fall.
Philadelphia International Airport (PHL)
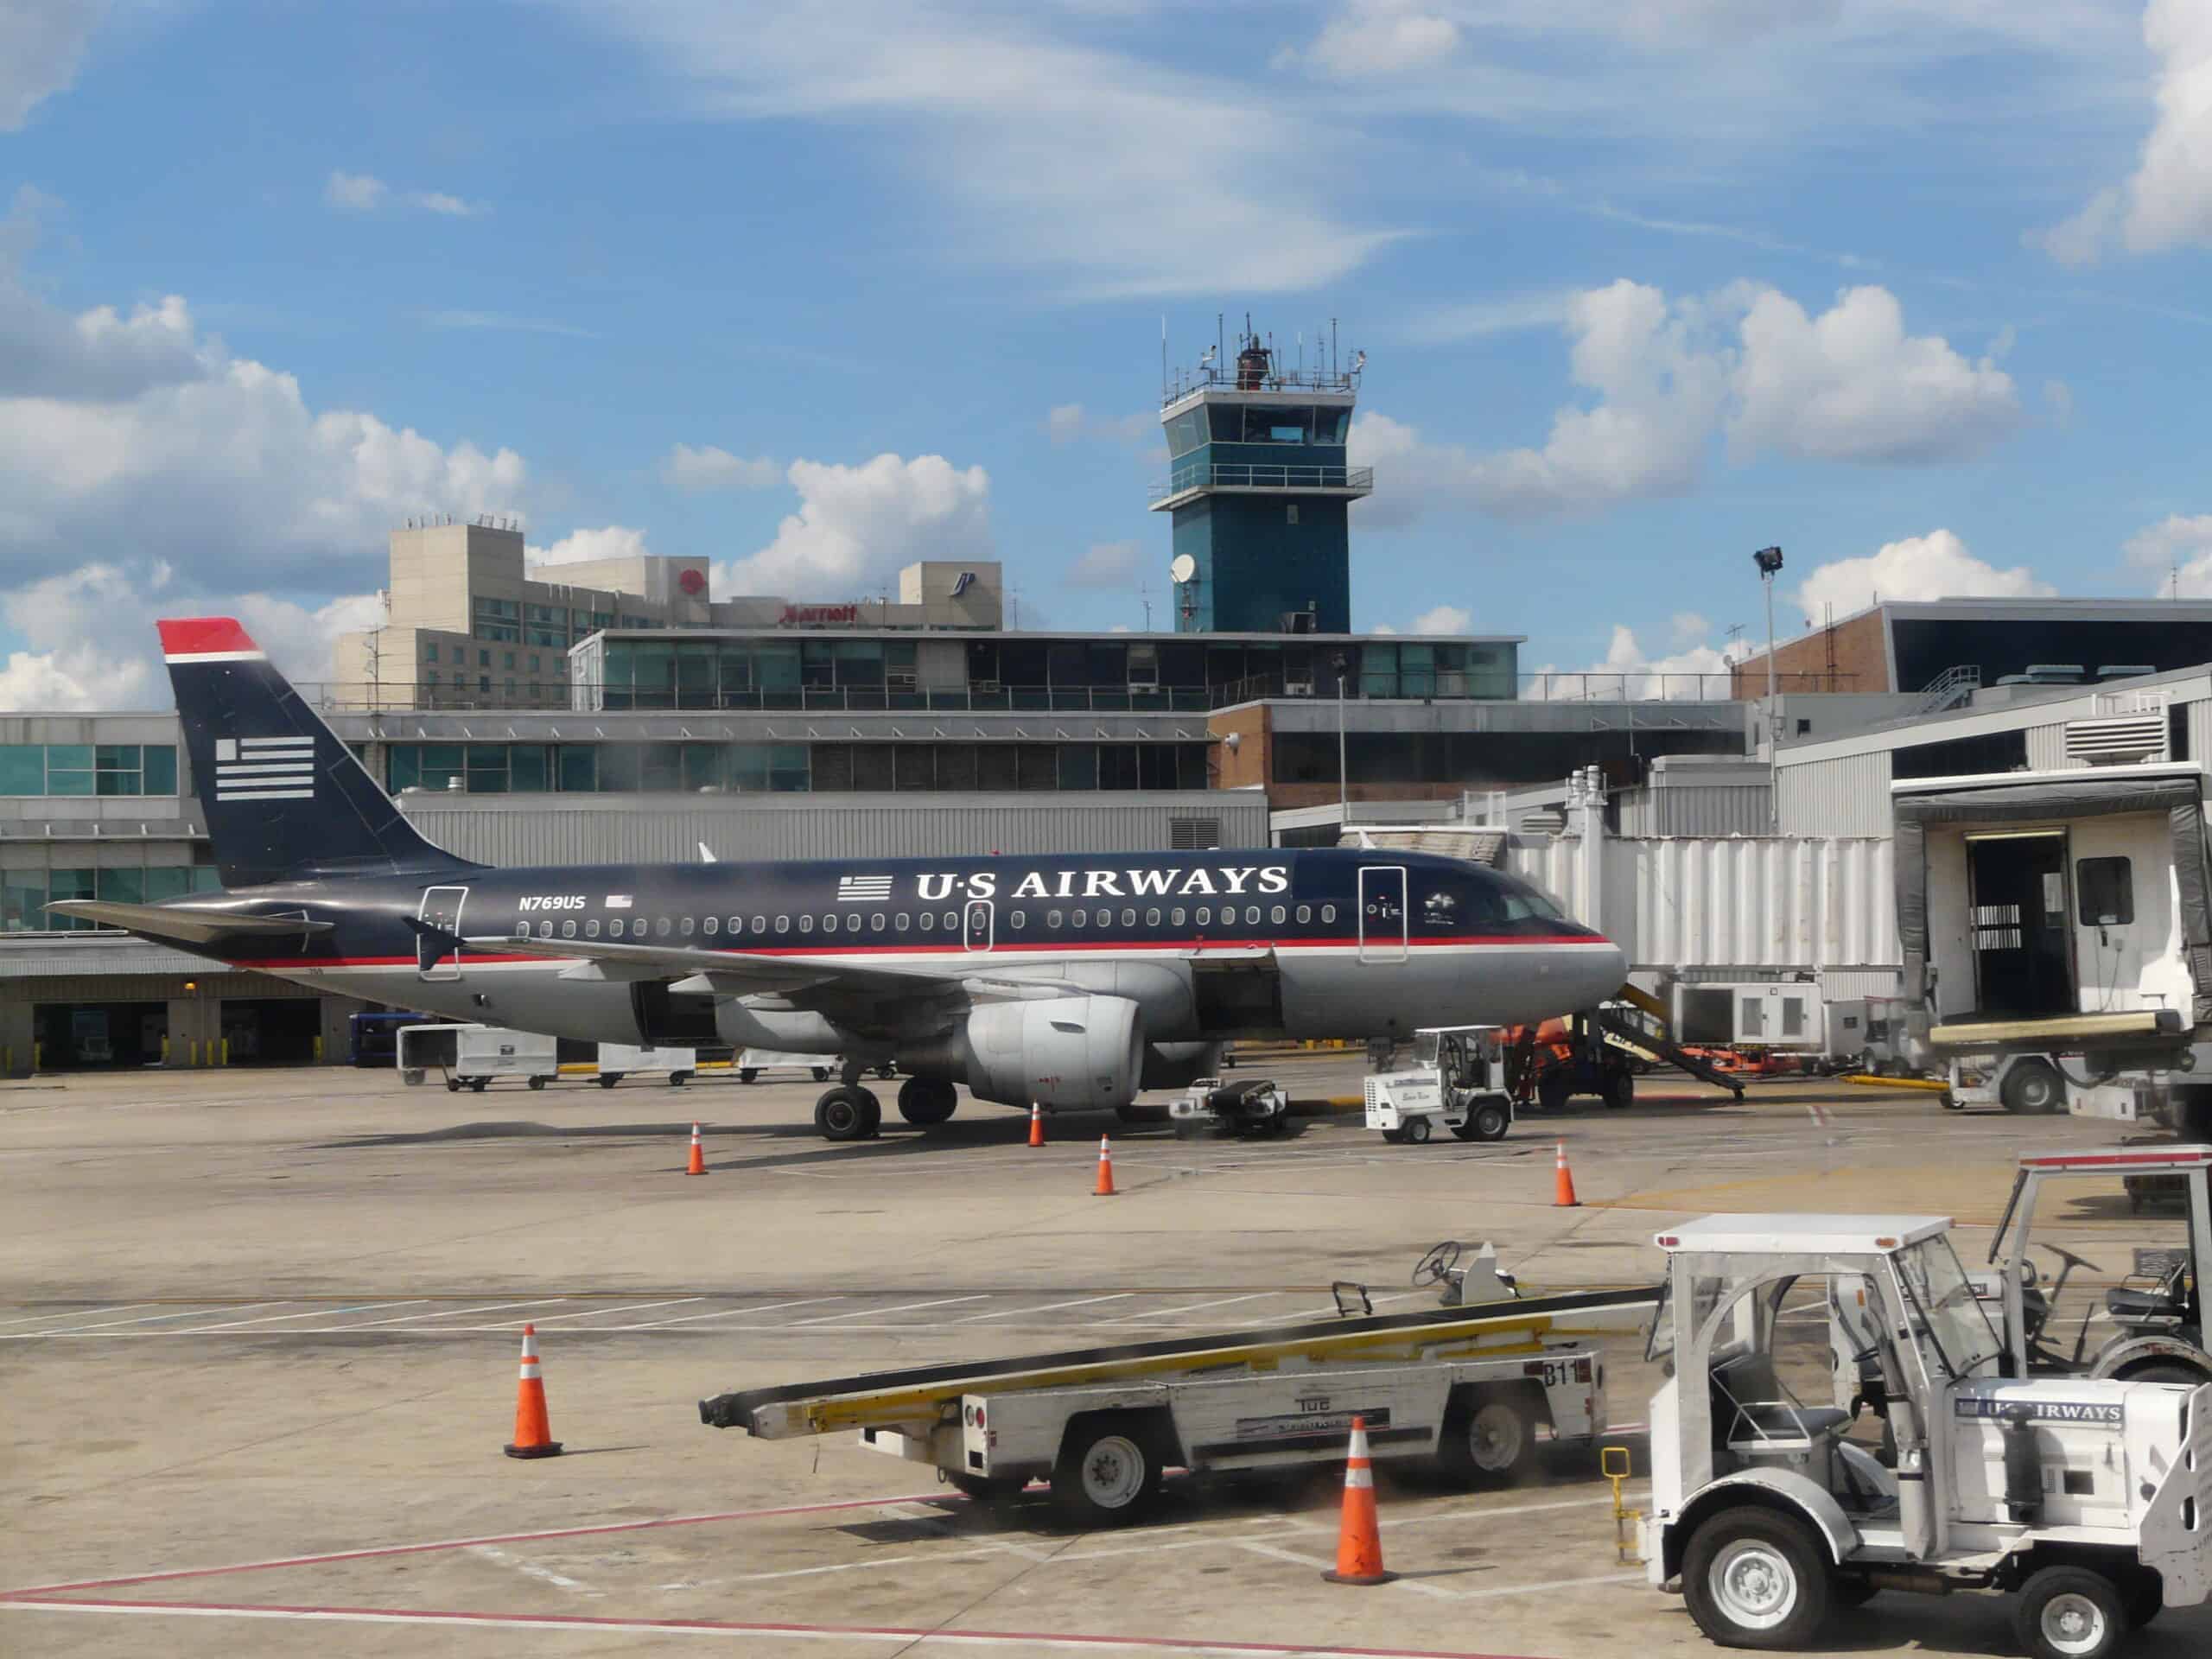
Philadelphia sits under the same Northeast weather and traffic programs that snarl the corridor, so delays often feel inherited, not local, especially when storms push aircraft into holding patterns. In DOT’s June 2025 Air Travel Consumer Report, on-time arrivals at PHL were 66.5%, and once aircraft and crews get out of position the airport can spend hours playing catch-up across short-haul routes. The vacation damage is subtle and expensive: a missed evening connection, a hotel check-in after midnight, and a first day rebuilt around what is still available, not what was planned, with tours and tickets reshuffled to fit the new reality.
LaGuardia Airport (LGA)
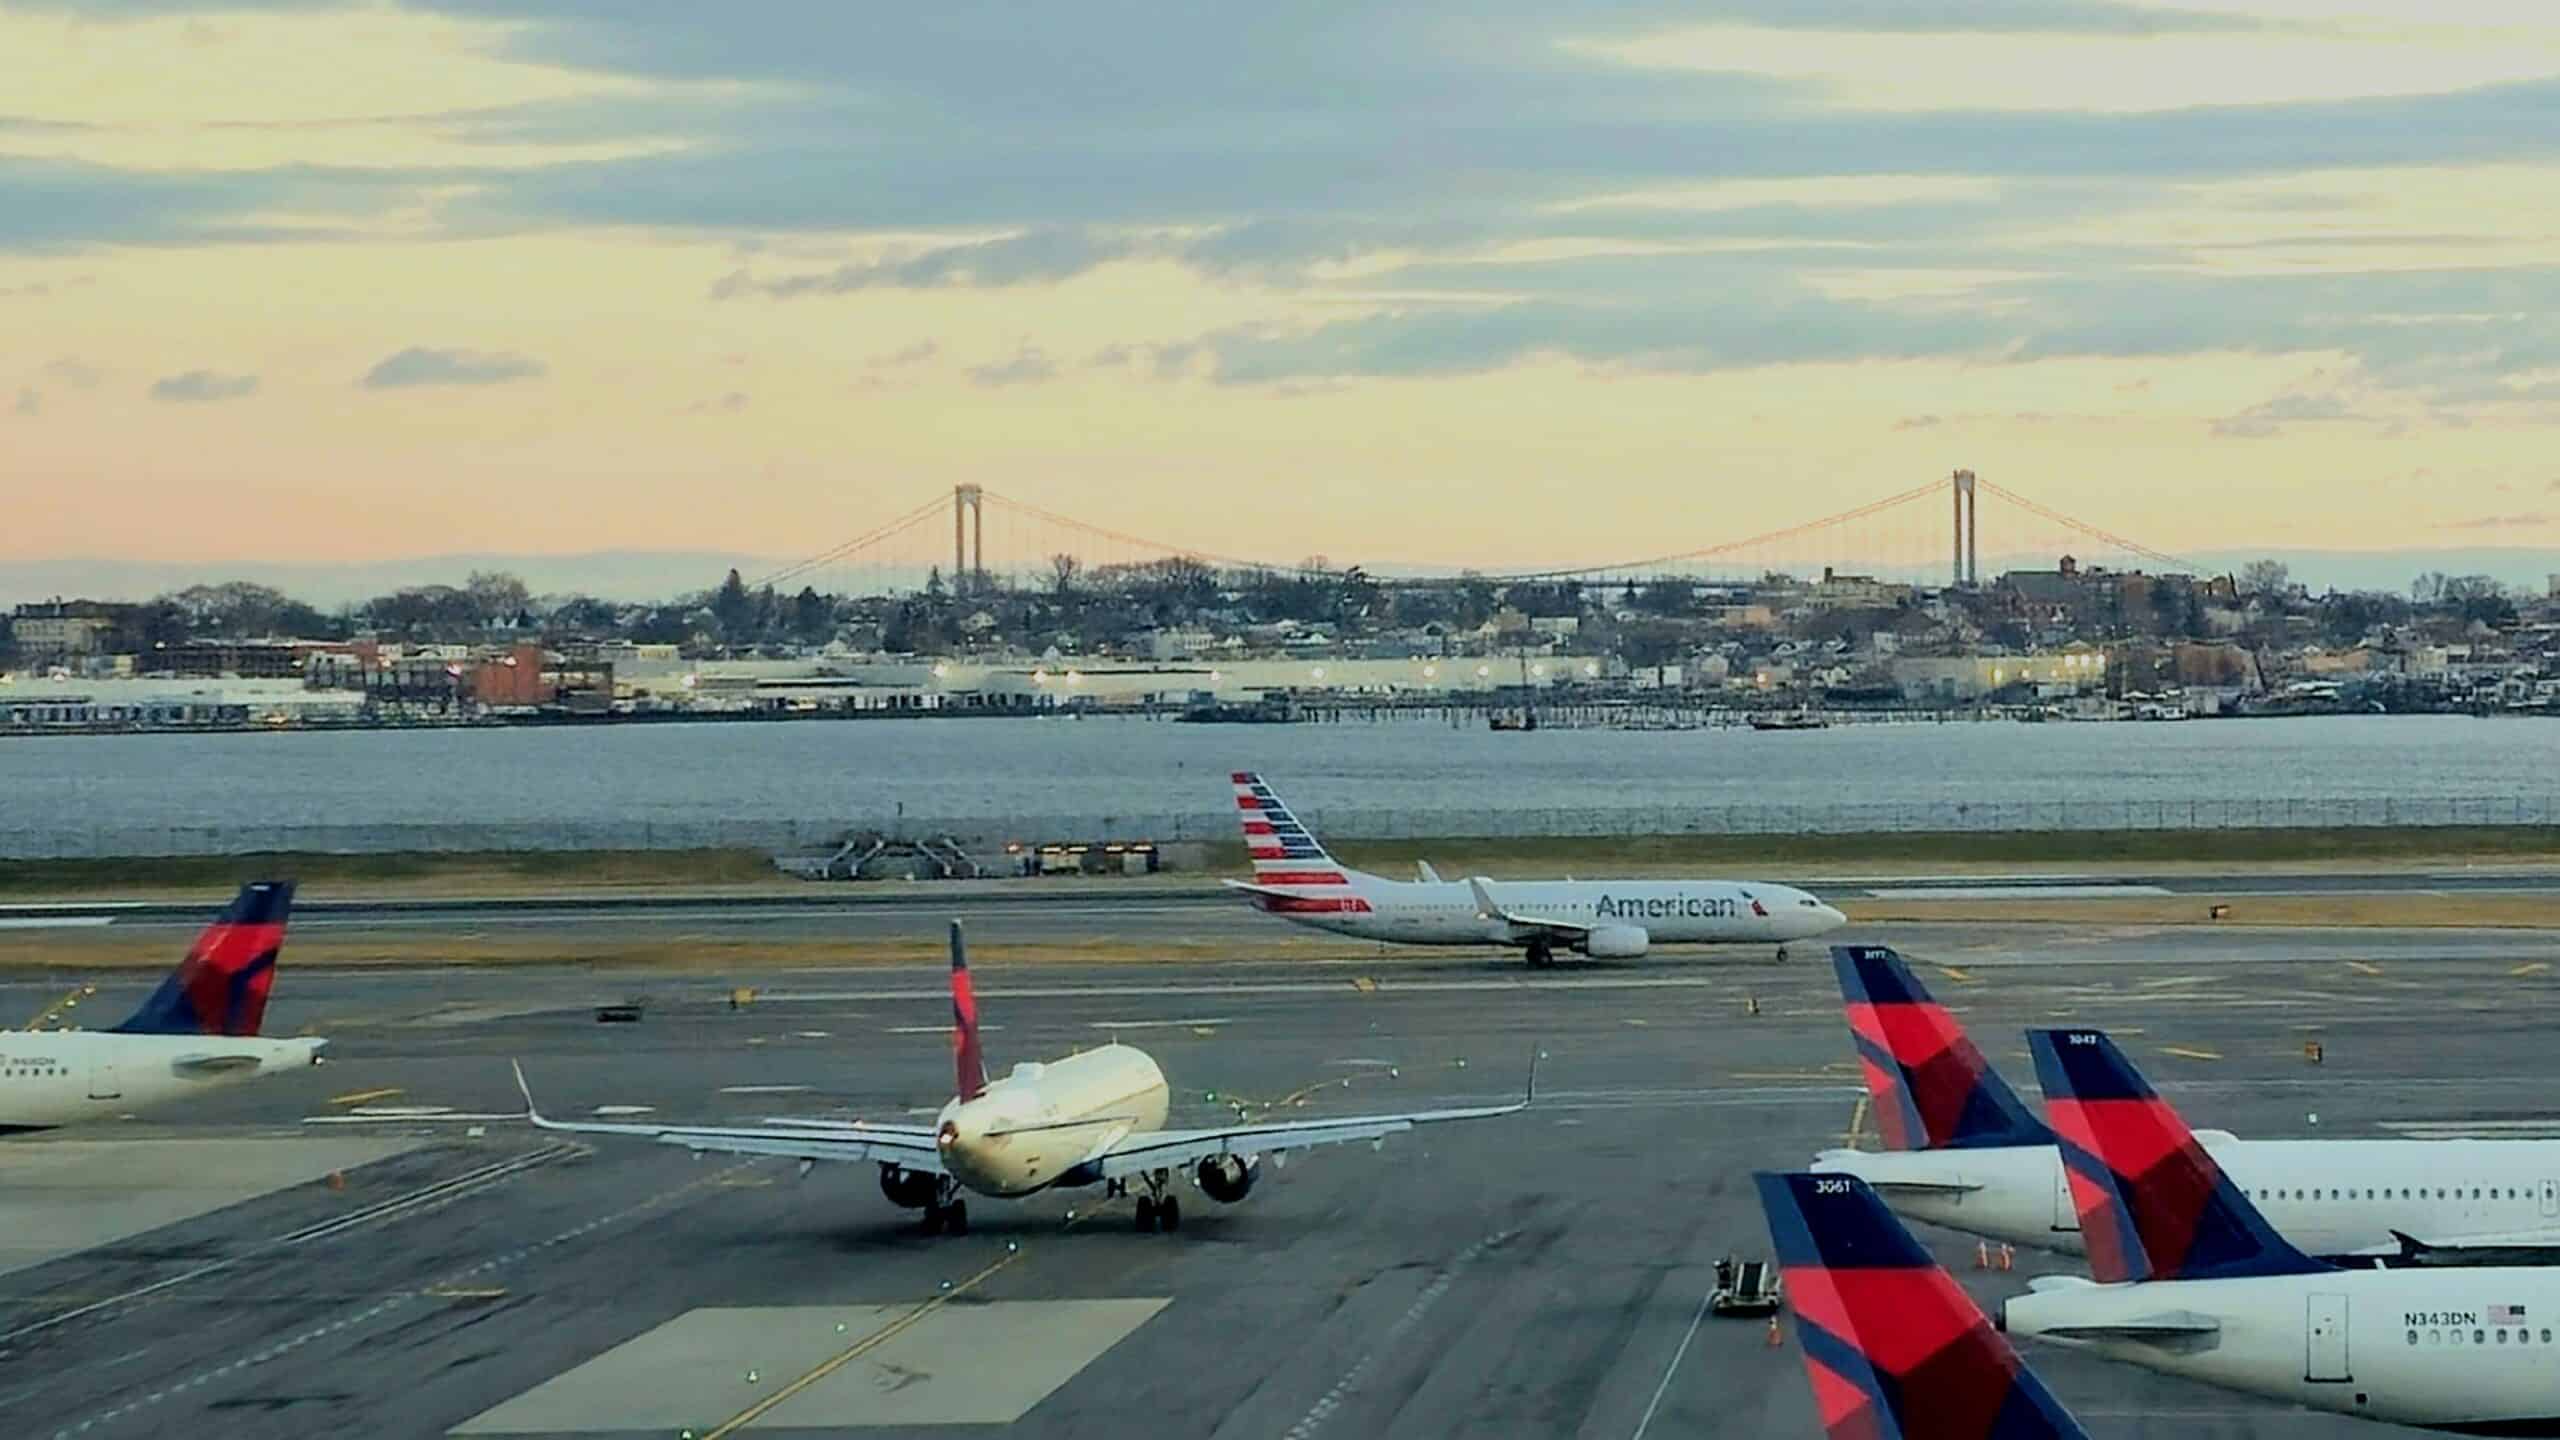
LaGuardia can feel efficient when the day is calm, but its tight schedule, short taxi distances, and limited recovery room mean small disruptions spread quickly across the board, especially at rush hour. In DOT’s June 2025 Air Travel Consumer Report, on-time arrivals at LGA were 63.1%, and when New York airspace tightens there is little slack to reroute or make up minutes later. The result is a familiar spiral: gate holds, planes waiting for gates, and a simple weekend plan turning into a cross-town scramble because the best backup flight is often out of Newark or JFK, not the terminal in front of everyone, and luggage may not follow.
Chicago O’Hare International Airport (ORD)
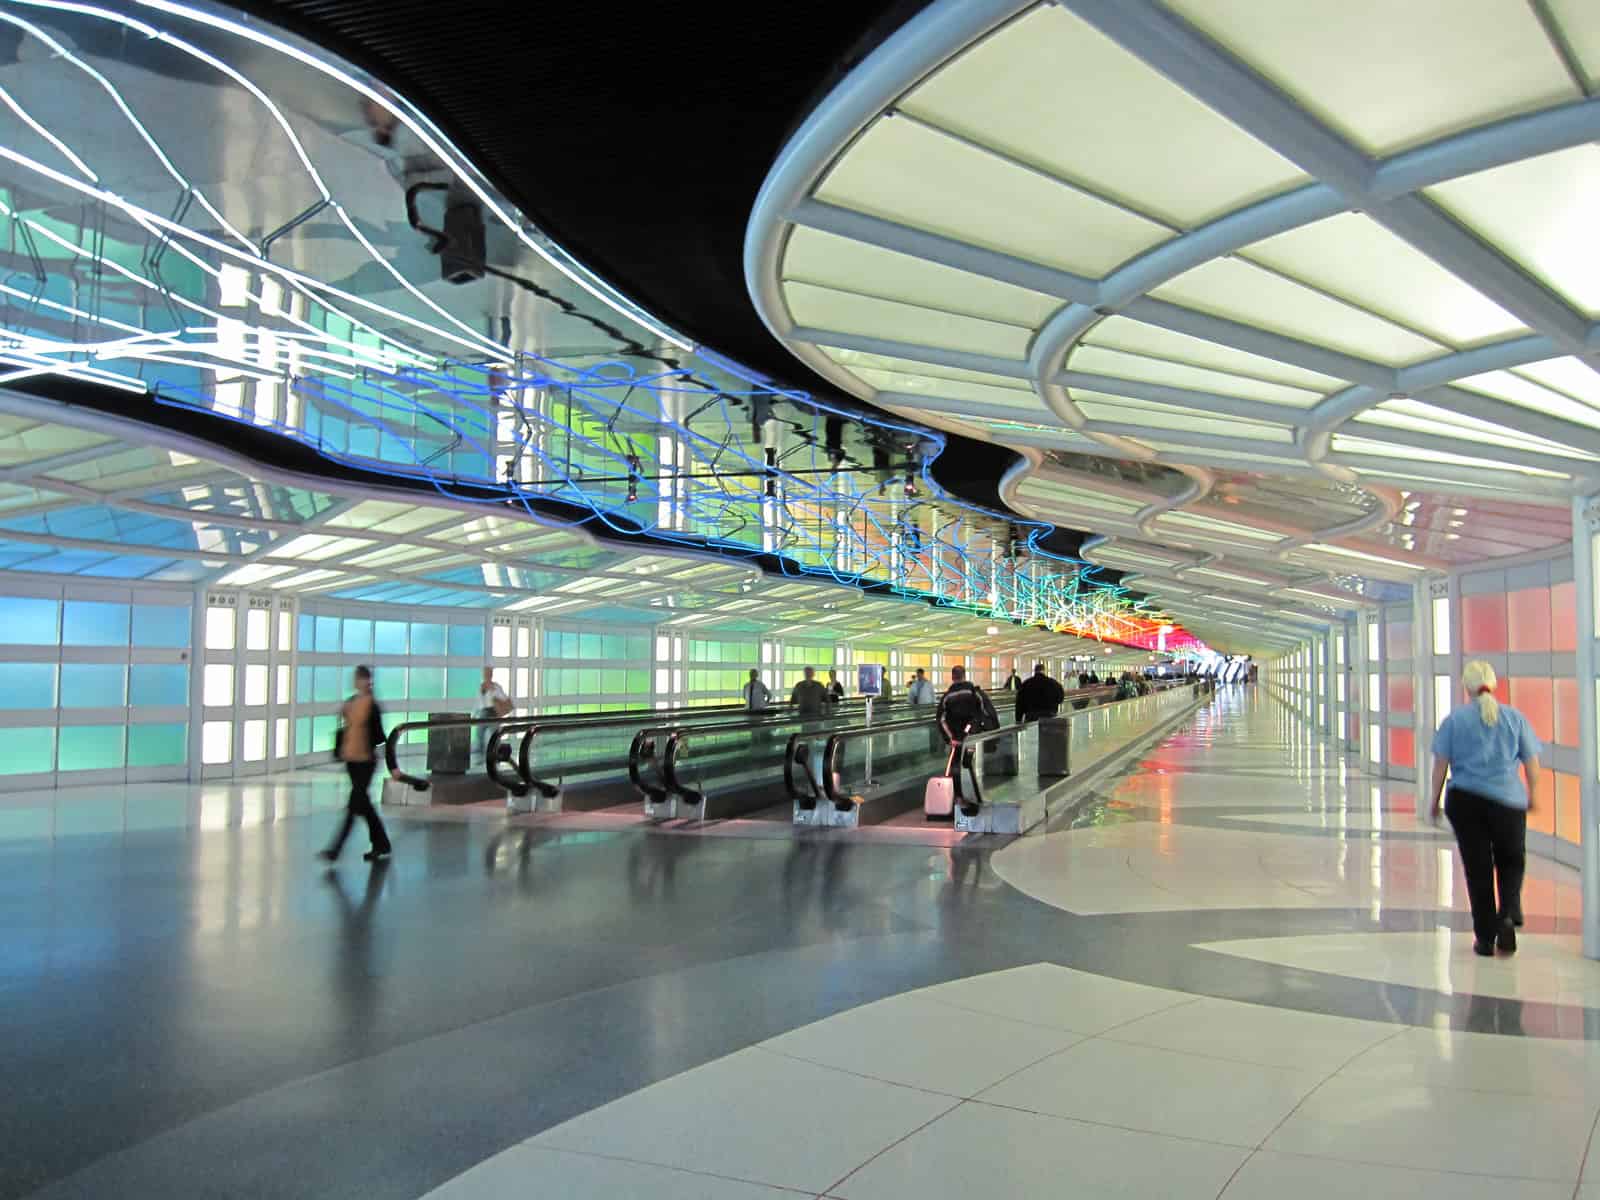
O’Hare is a national hinge point, so congestion there can echo outward, especially when runway configurations change with Midwest wind, lake-effect weather, and winter deicing. In DOT’s June 2025 Air Travel Consumer Report, on-time arrivals at ORD were 70.3%, and that number can dip fast when the operation shifts modes and taxiways turn into a slow-moving puzzle of holds and merges. When O’Hare slips, it is not only Chicago that waits: connections break nationwide, crews hit duty limits, and the rebooking line starts to look like a second security checkpoint, with the same tired faces in it as diversions and reroutes stack.
Charlotte Douglas International Airport (CLT)
Charlotte’s strength is connections, and that hub design also makes delays feel contagious once an inbound arrives late and the next wave loses its aircraft across the concourses. In DOT’s June 2025 data, on-time arrivals at CLT were 70.2%, but the airport’s tight bank structure means a single storm line can splinter dozens of onward flights within an hour. When that happens, travelers get trapped in in-between time: close enough to the destination to feel it, far enough away to lose the hotel night, and stuck watching gates flip and apps refresh as crews and planes get reassigned in real time, sometimes twice, sometimes to tomorrow.
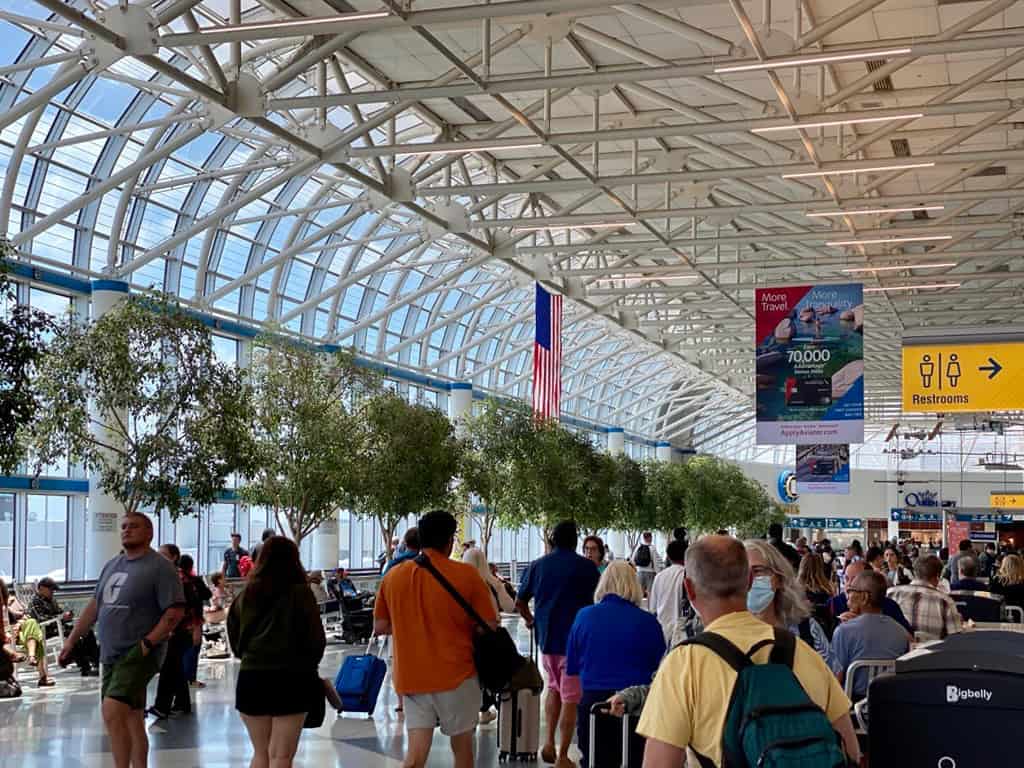
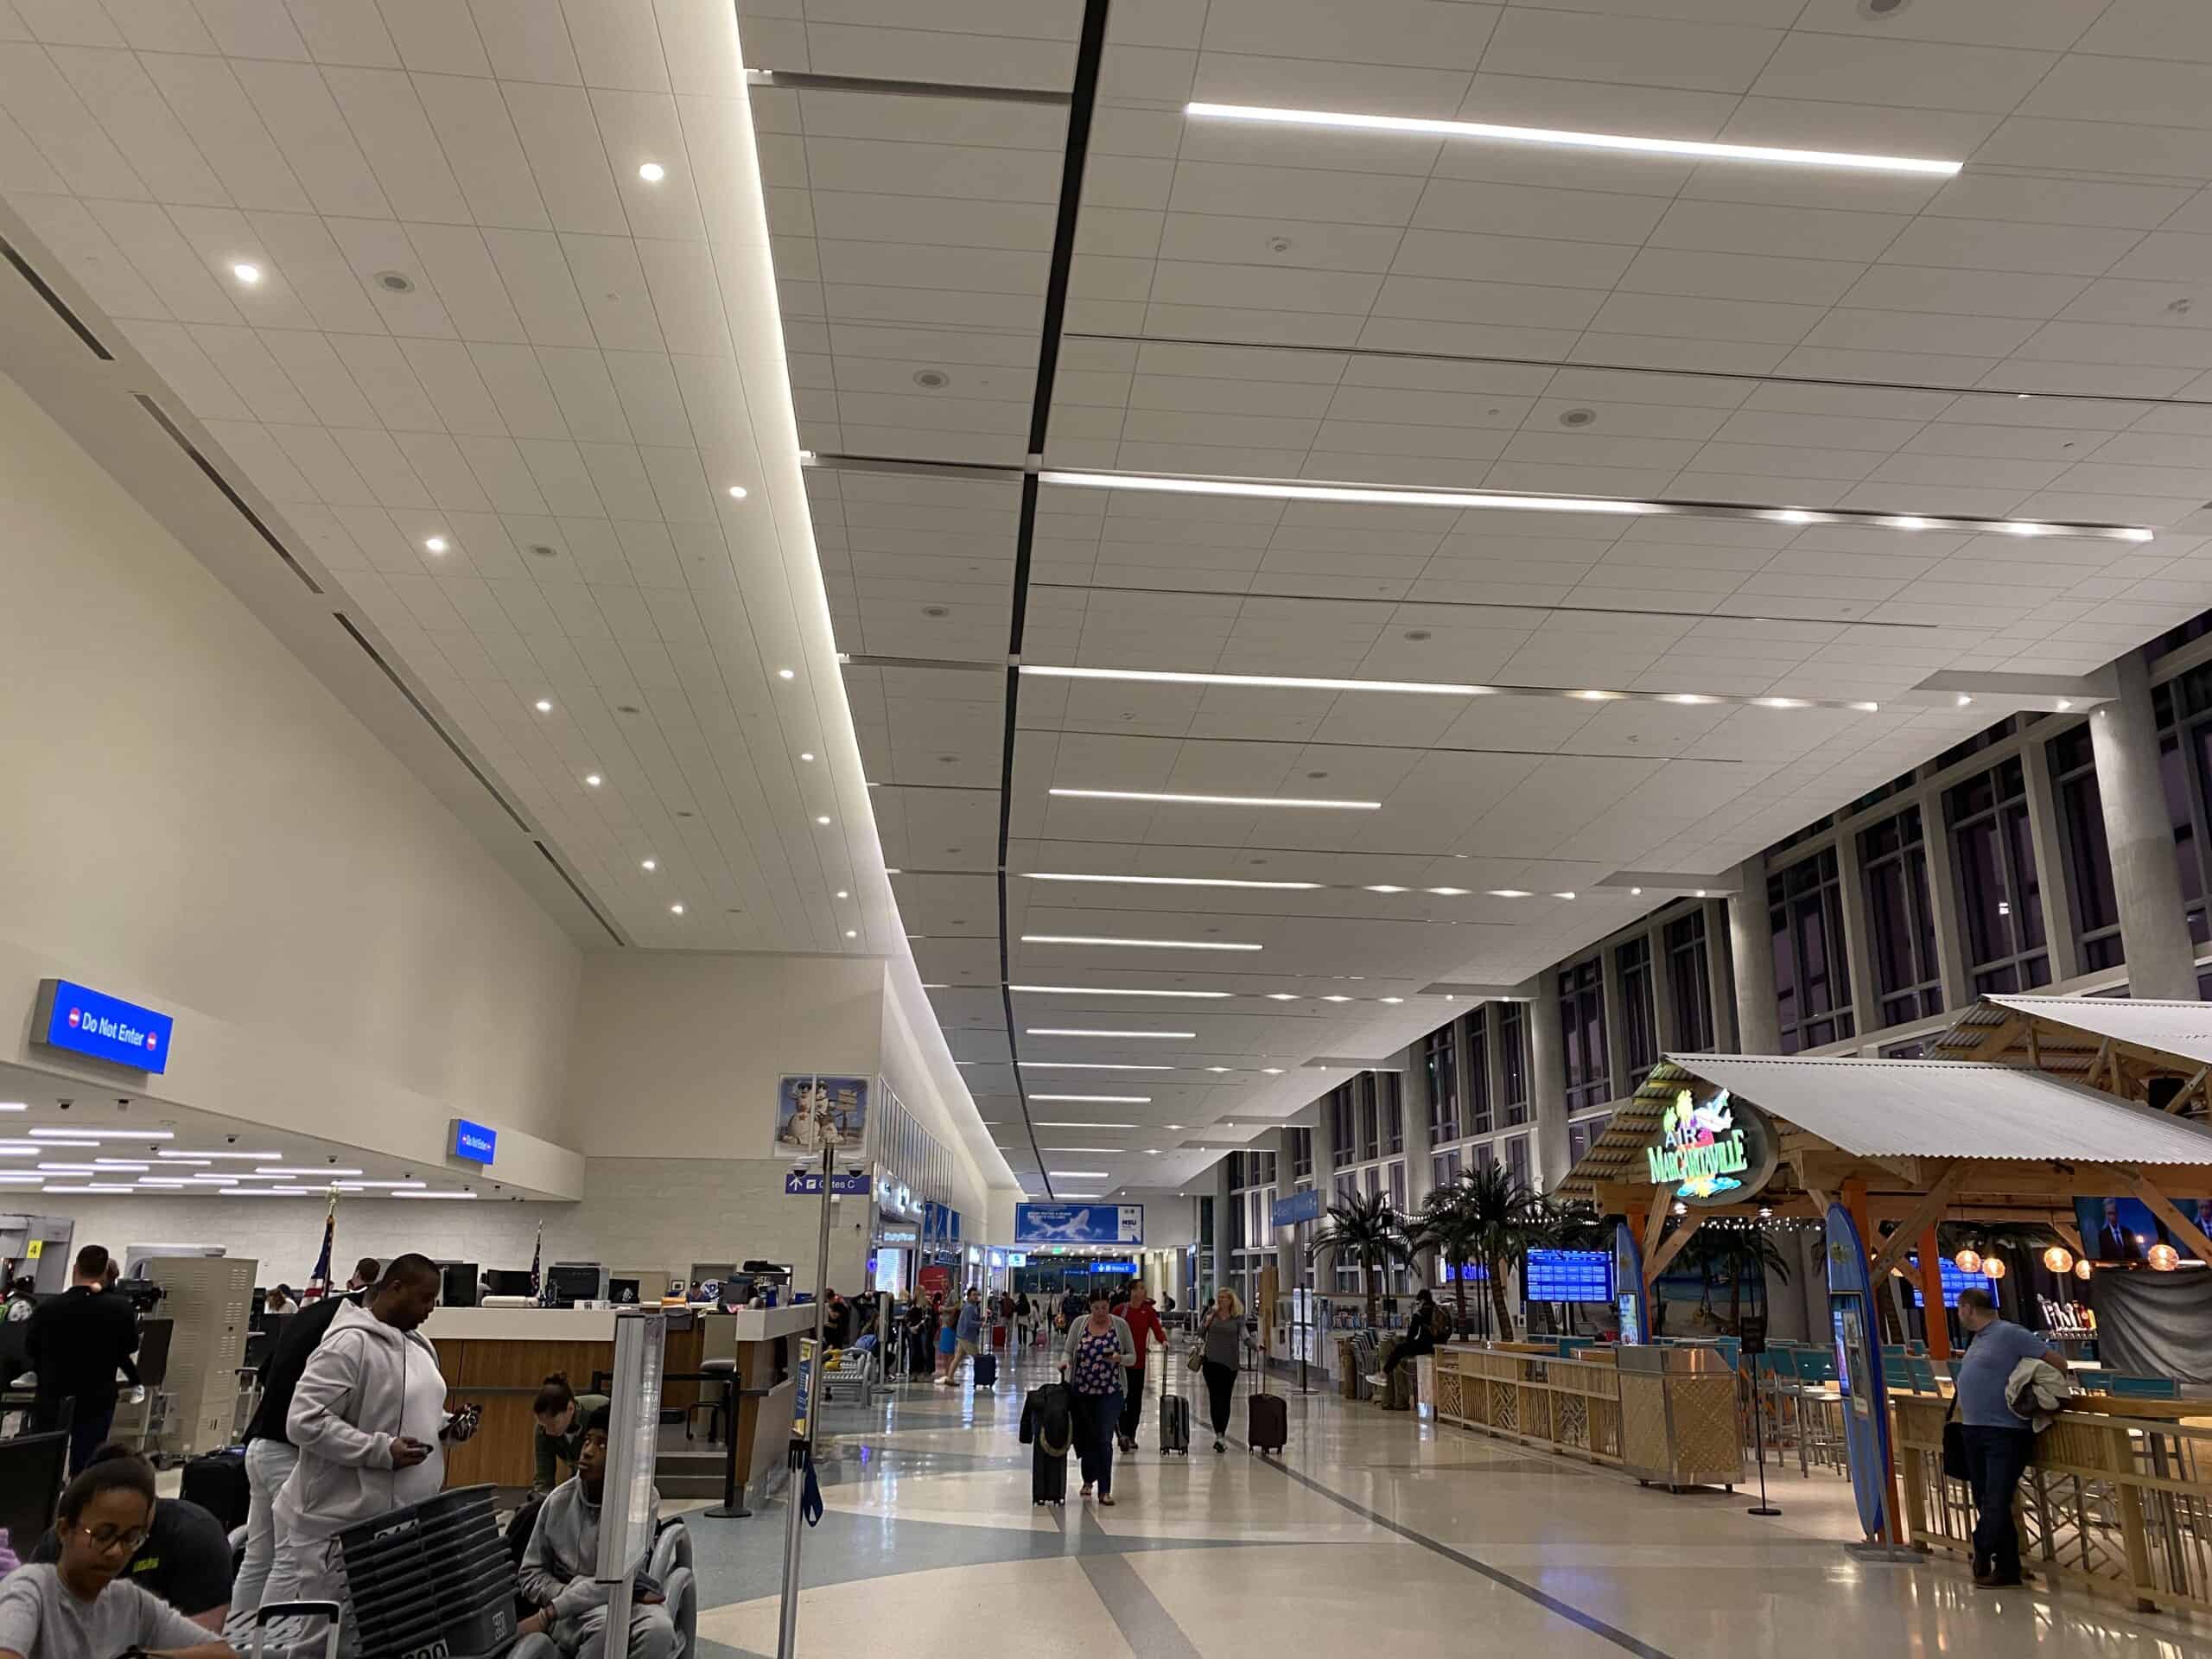
Orlando International Airport (MCO)
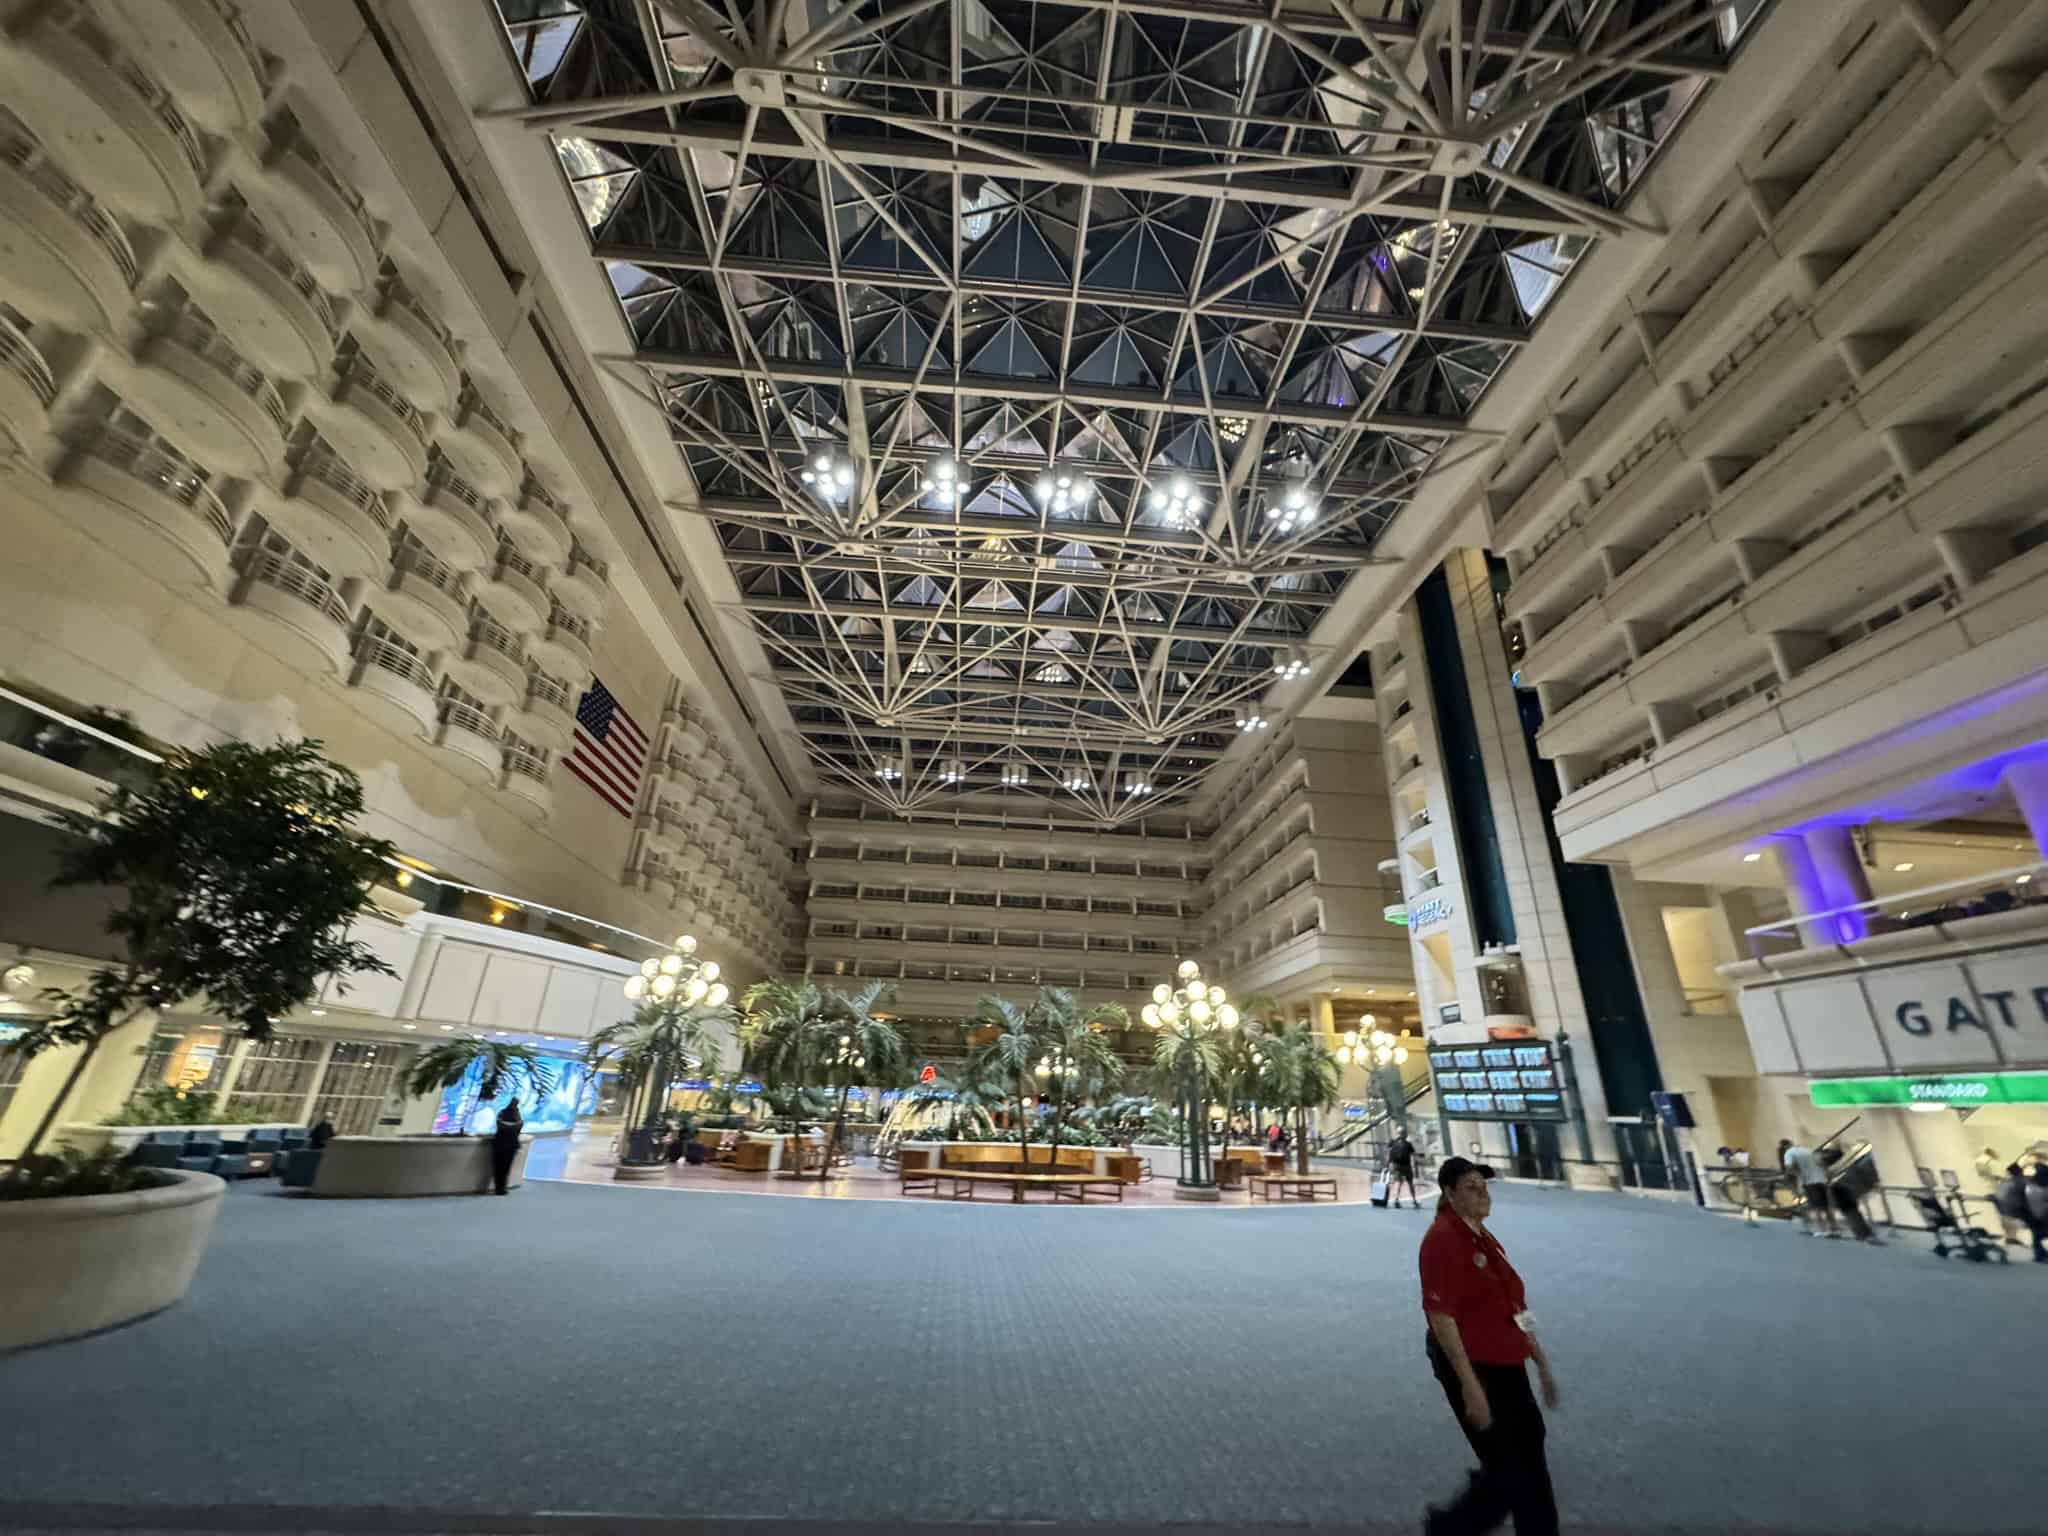
Orlando is built for vacations, which is why delays land harder there than at a business hub where plans can flex and meetings can be pushed an hour. In DOT’s June 2025 Air Travel Consumer Report, on-time arrivals at MCO were 68.1%, and peak family travel means the same storm that slows arrivals can also jam shuttles, rental lines, and late-night check-ins across the region. The ripple effect is practical, not dramatic: missed cruise transfers, park reservations that cannot be moved, and tired kids in a terminal at 10 p.m. while everyone quietly recalculates what the first day will now look like, down to stroller pickup and baggage carousels.
Miami International Airport (MIA)

Miami sits at the meeting point of tropical weather and international schedules, so a short thunderburst can throw off connections to the Caribbean and Latin America for the rest of the day. In DOT’s June 2025 data, on-time arrivals at MIA were 70.3%, and the real trouble starts when late arrivals fill gates and departing flights cannot leave because their aircraft is still in the sky or stuck on a taxiway. That is how a beach week begins with logistics: missed shuttles, extra hotel fees, and a search for food near the terminal while bags, check-in windows, and hotel rooms wait on separate timelines, all drifting later together.
Fort Lauderdale Hollywood International Airport (FLL)
Fort Lauderdale is a beach-and-cruise gateway that often runs close to capacity, so the margin for recovery is thin when South Florida weather flips or ground stops ripple in from Miami. In DOT’s June 2025 data, on-time arrivals at FLL were 70.1%, and the stress shows up when late arrivals crowd gates and departing flights wait for crews and aircraft trapped in the delay chain. The vacation risk is timing: a missed sailing, a shuttle that leaves without the group, and a scramble for last-minute rooms near Port Everglades while the itinerary gets rebuilt around the seats that remain, if any, and the clock keeps moving longer than expected.